Release notes BellaDati 2.7.2Release date: November 12, 2012 Preview| Section |
|---|
| Column |
|---|
| 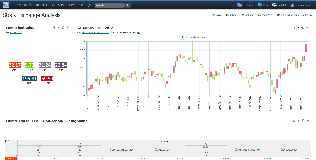 Image Modified Image Modified
|
| Column |
|---|
| 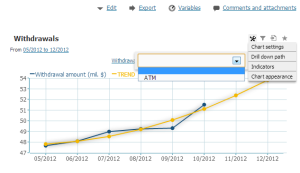 Image Modified Image Modified
|
| Column |
|---|
| 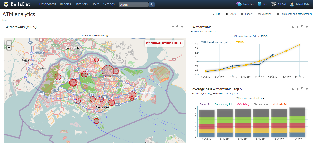 Image Modified Image Modified
|
| Column |
|---|
| 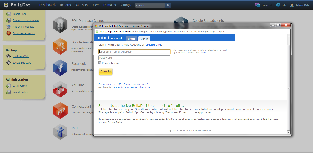 Image Modified Image Modified
|
|
New Features- Report - Add quick drop down settings for chart views
- Candle chart
- Intuit connector
- Timezone support for users
- Report, views - enable filtering for viewers
- Charts appearance - allow to disable grid
- Charts appearance - allow to display values directly in charts
- Report - quick indicators/attributes selection drop down menu
- Maps iFrame sharing
Improvements- Improve cell highlighting in tables
- Time interval defined by formula - add icon to recognize difference between normal and formula defined time interval
- Report, charts - if no drill-down is selected, allow to set it from "clever" caption
- Enable to place indicators on x-axis of multiple-indicators charts
- Formula indicator - Improve keyword and values menu
- Thermometer chart - display one y-axis for single indicator
- Report, indicator - Separate option of indicator color and filled area (line, combined and radial charts)
- Report, chart - Allow to set dotted and dashed appearance individually for each indicator (line & radial chart)
- Report, chart - Add dash-and-dot line style (line, combined, radial charts)
- Maps - display warning message when no appropriate geo-data has been found for specified drill-down
- Avoid processing of zip-bombs
- Performance improvements
- Data set - Show progress of join materialization
- Report - Apply number&decimal format setting for domain in indicator conditional formatting
- Formula indicator - Add function to get drill-down member attribute name
- Formula indicator - Add function to get full drill-down path
- Twitter XML export/import
- Data set, import - add information when the import was finished
- OnPremise, Setup wizard - show server-id within the textfield
- Redirect to search page after deleting the report
- Candle chart and intuit connector wizard
- Geo maps - Zoom in map with points by default
- Candle chart - Add option to set colors
- KPI label - Display colored indicators with rounded edges
Bug fixes- Cannot escape moving of popup dialog if a non-window event is fired
- Data set, indicator - Changing settings in one character indicator doesn't work
- Report, export - Export file is empty when view contains invalid formula
- Cannot set aggregation to the indicator group with empty formula indicator
- XML backup - NPE occurs during backup
- Report, time - Display in single column option is moved upwards
- Report attachments - do not check upload status periodically
- Dashboard - Drag drop does not show labels (drag here etc.)
- Report, chart - Higher charts are cropped when inserted new
- Tables - Hide comments bubble after scroll
- Report, maps - Hide link to Manage places definitions if I don't have domain or data manager roles
- Data set detail - mouse over "more" import details doesn't work
- Report, table - missing horizontal scroll in Firefox
- Data source, URL - changing import settings doesn't show the imported data
- Combined charts - sorting by indicator name doesn't order members on x-axis
- Report, copy - custom members are not copied correctly
- Report - Save/undo diskette appears even if nothing changed
- Table - Quick menu click on Indicators link leads to blank popup
- Report - quick drill-down selection doesn't display used attribute
- Report - moving popup closes it
|