Page History
| Sv translation | ||||
|---|---|---|---|---|
| ||||
XY chart allows having numeric values (indicators) on both axes. Due to the nature of the chart, following limitations are applied:
Creating XY Chart in BellaDati 2.9.3.5 and Older
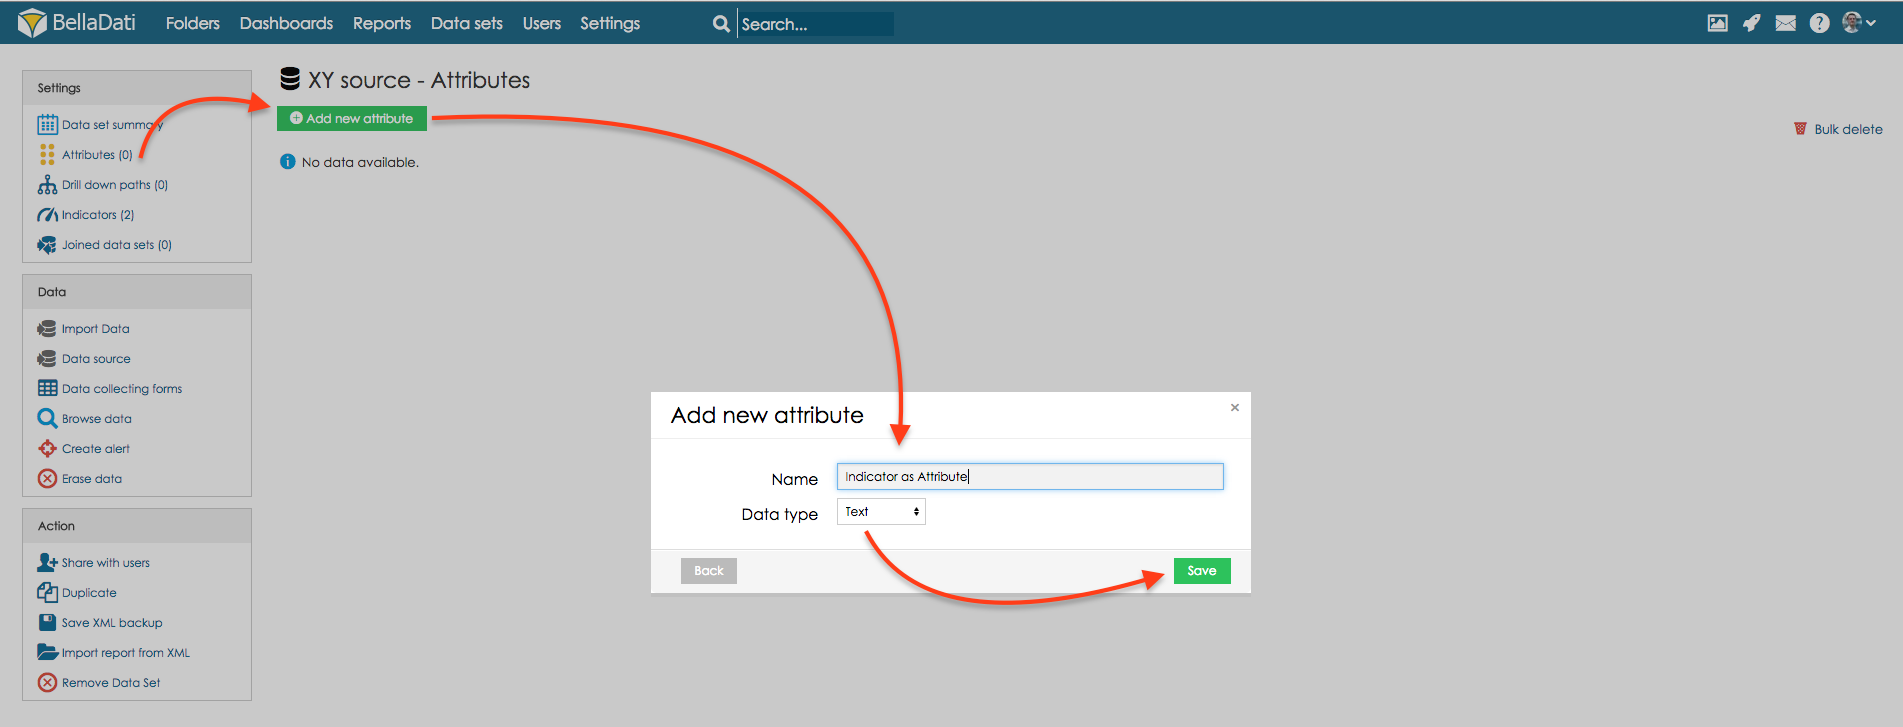
In XY scatter chart, there are displayed indicators on both axis of the chart. In BellaDati, there can be displayed indicator value on one axis only, so we have to transform indicator value into new attribute. 1. Transform indicator into attributeOpen source data set. Create new attribute of type Text.
Transform indicator values into this attribute. For this option, click on transformation script icon of newly created attribute and use transformation script, that will return value with indicator values:
For more information about transformation scripting, go to Developers section.
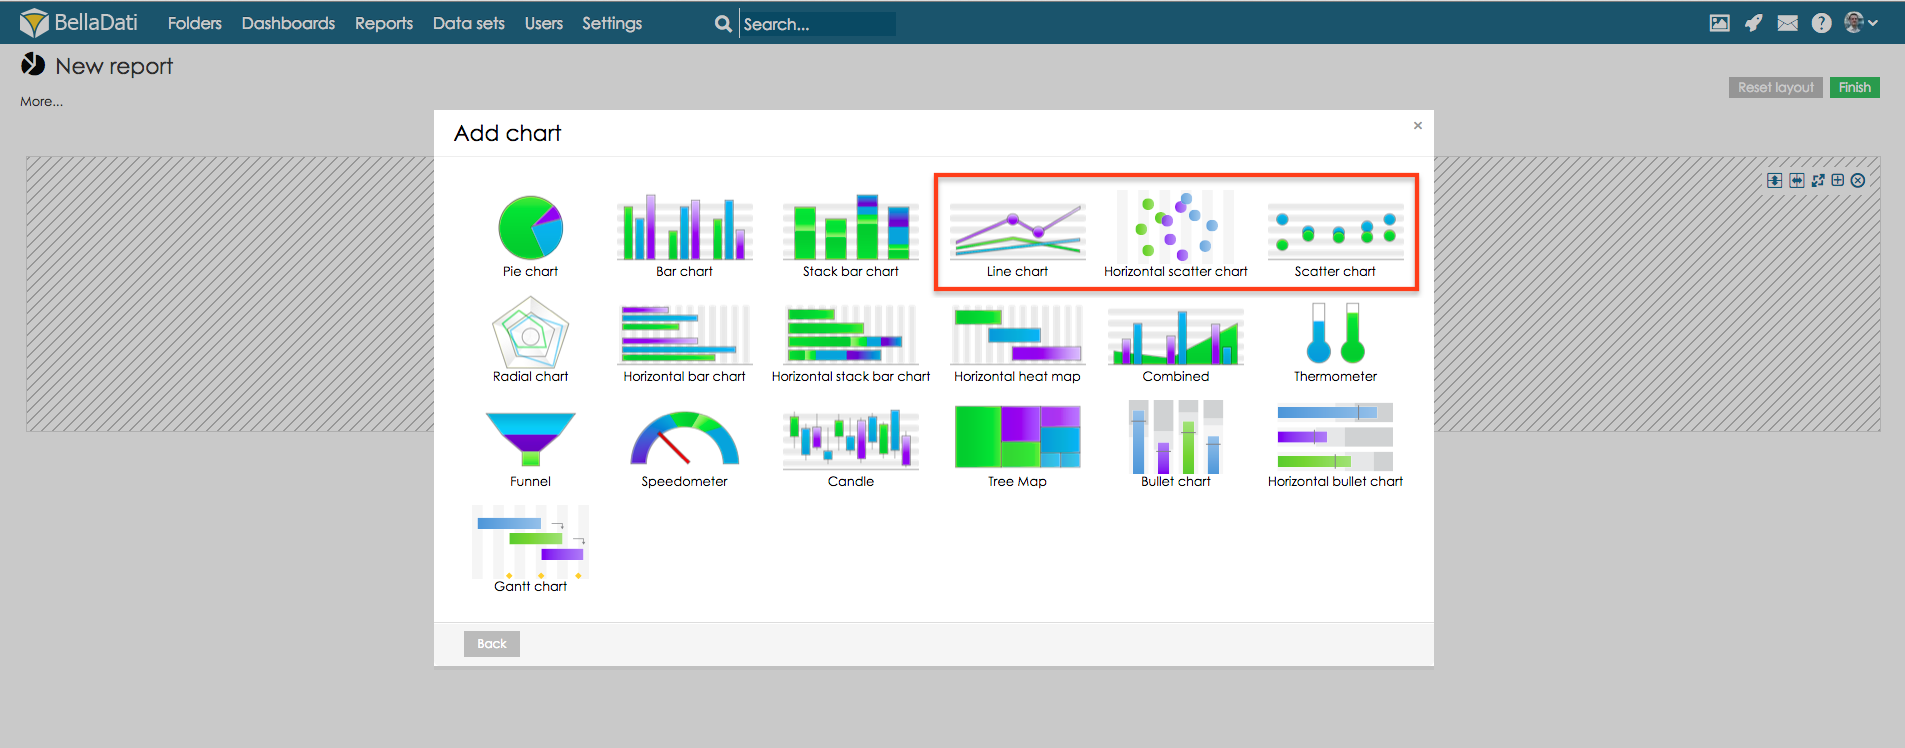
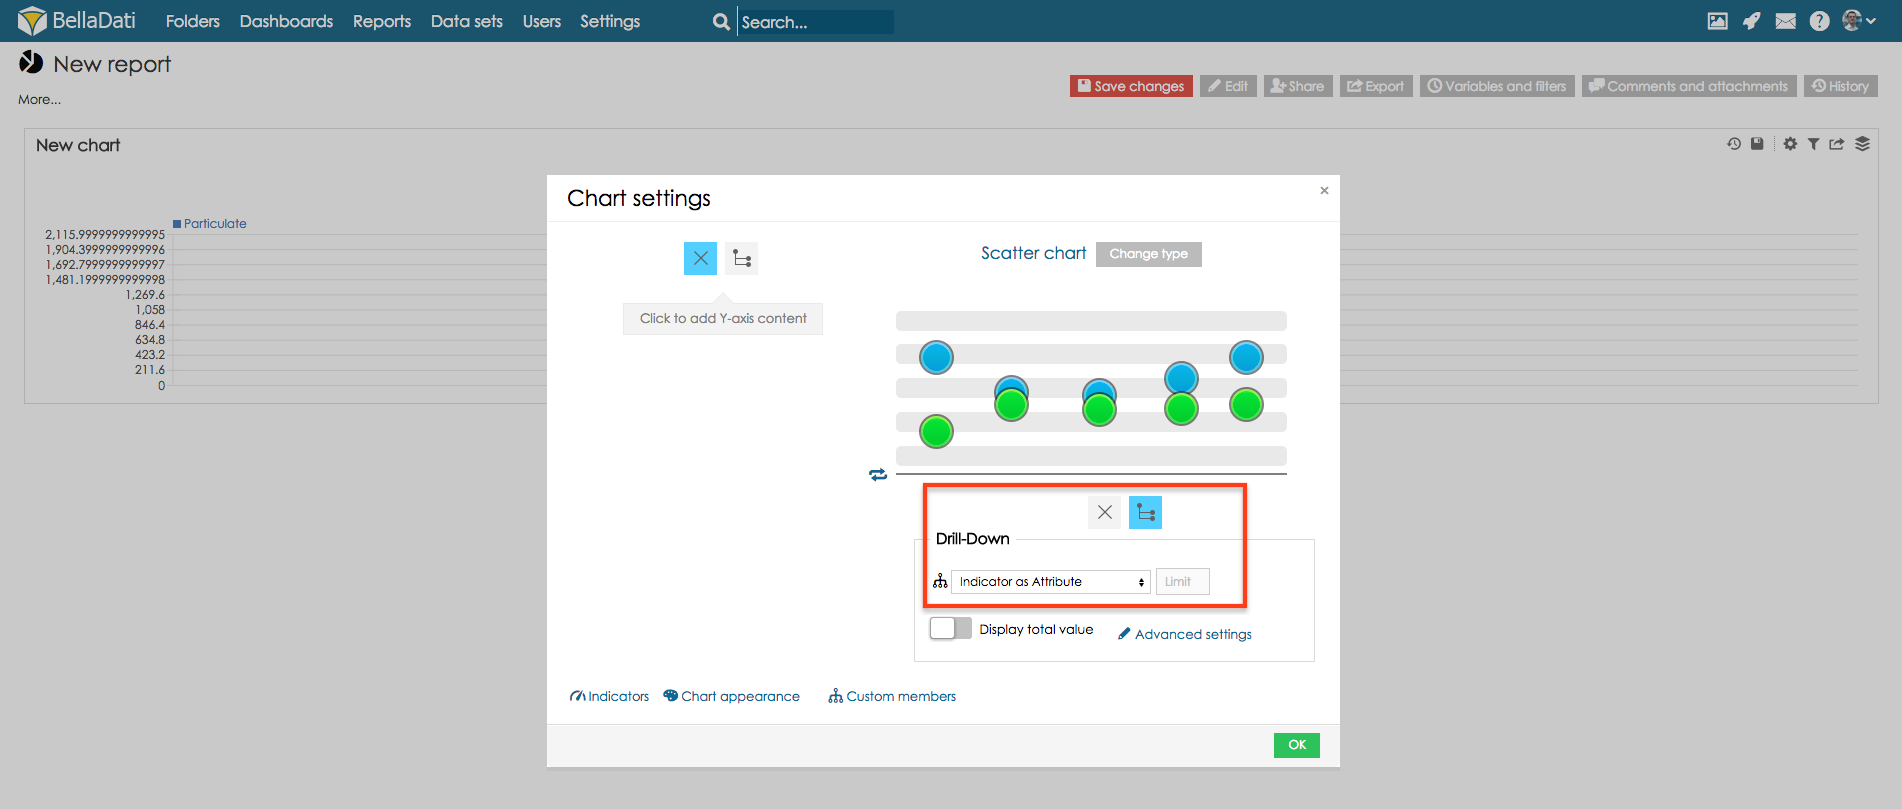
2. Create chartNow, go back to the report, which is based on this data set or create new report. Now let's create new XY chart. Create new view, select scatter chart, horizontal scatter chart or line chart.
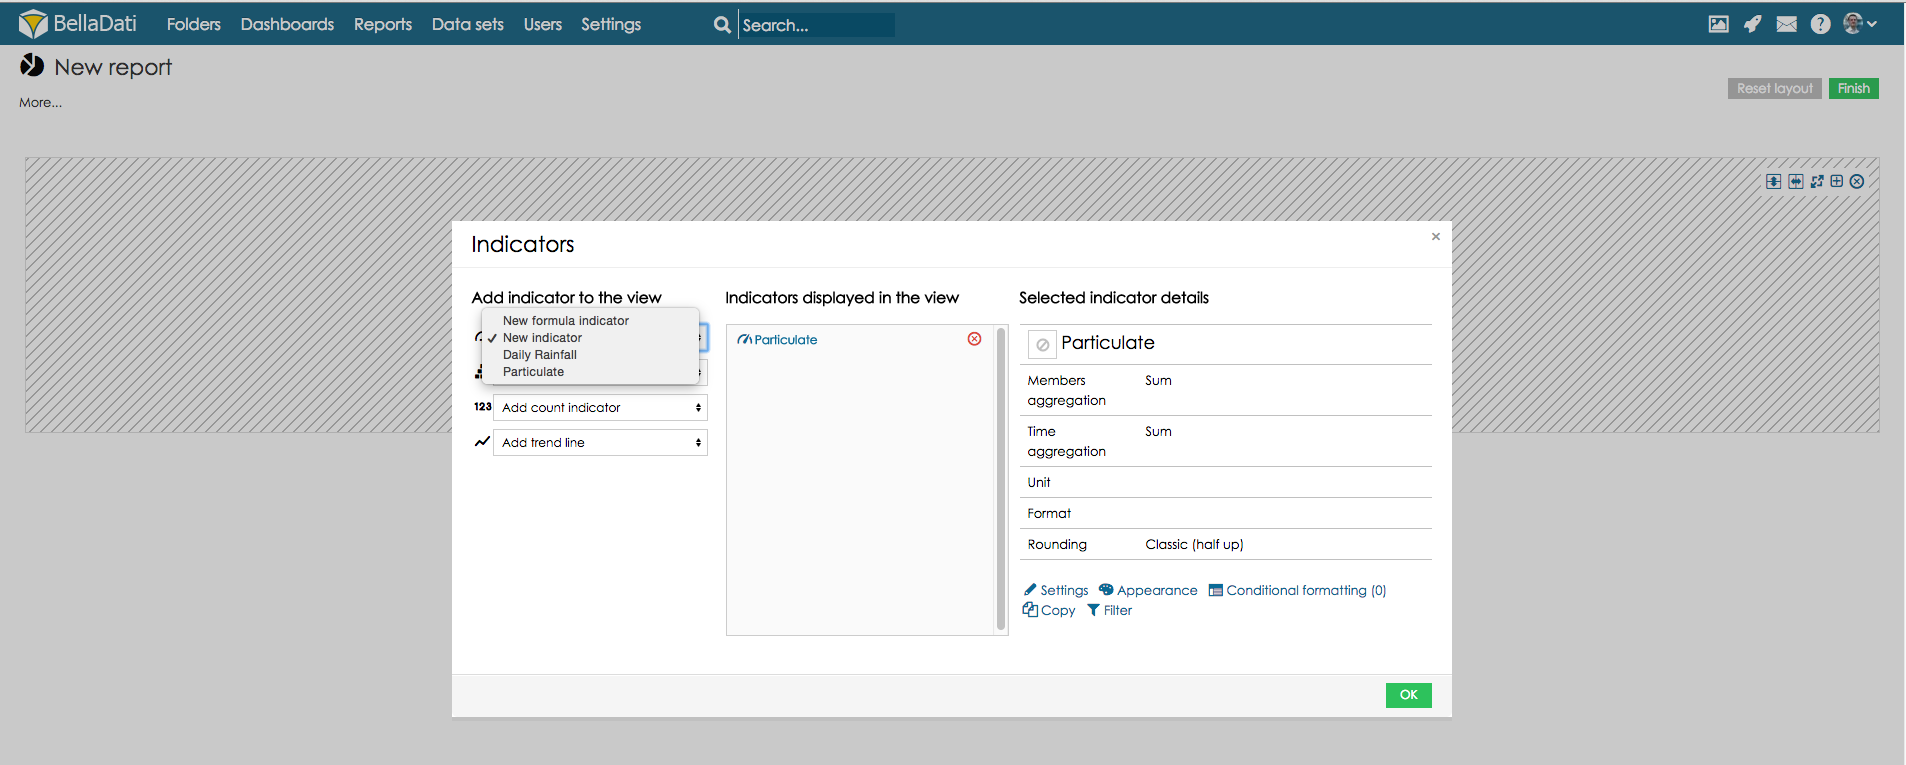
Select indicator which should be displayed.
Select drill-down that contains indicator values.
XY chart is created.
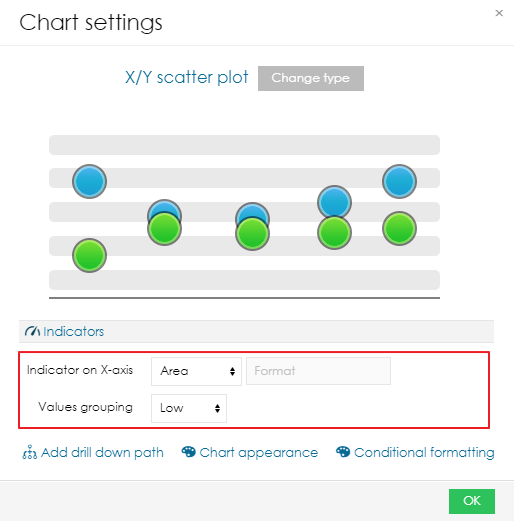
3. Additional settingsProblem: source data contain a lot of different values. This causes that values are not displayed correctly on axis with attribute.
Solution: in this case, we need to round attribute values. This should be done via transformation scripts. Proceed to use case with change of decimal values described.
|


| Sv translation | ||||
|---|---|---|---|---|
| ||||
XYチャートでは、両方の軸に数値(インジケータ)を表示できます。チャートの性質により、次の制限が適用されます:
BELLADATI 2.9.3.5以前でのXYチャートの作成
XY散布図では、グラフの両方の軸にインジケータが表示されます。 BellaDatiでは、1つの軸にのみインジケータ値を表示できるため、インジケータ値を新しい属性に変換する必要があります。 1. インジケータを属性に変換するソースのデータセットを開きます。テキストタイプの新しい属性を作成します。
この属性にインジケータ値を変換します。このオプションでは、新しく作成された属性の変換スクリプトアイコンをクリックして、変換スクリプトを使用します。これにより、値とインジケータ値が返されます:
変換スクリプトの詳細については、開発者セクションをご覧ください。
2. チャートの作成次に、このデータセットに基づくレポートに戻るか、新しいレポートを作成します。 それでは、新しいXYチャートを作成しましょう。新しいビューを作成し、散布図、水平散布図、折れ線グラフを選択します。
表示するインジケータを選択します。
インジケータ値を含むドリルダウンを選択します。
XYチャートが作成されます。
3. 追加の設定問題: ソースデータには多くの異なる値が含まれています。これにより、属性を持つ軸に値が正しく表示されなくなります。
解決策: この場合、属性値を丸める必要があります。これは、変換スクリプトを介して行う必要があります。区切り文字値の変更での使用例に進みます。
|
| Sv translation | ||||
|---|---|---|---|---|
| ||||
Das XY-Diagramm ermöglicht es, numerische Werte (Indikatoren) auf beiden Achsen zu haben. Aufgrund der Beschaffenheit des Diagramms gelten folgende Einschränkungen:
Erstellen von XY-Diagrammen in BellaDati 2.9.3.5 und älter
Im XY-Streudiagramm werden Indikatoren auf beiden Achsen des Diagramms angezeigt. In BellaDati kann der Indikatorwert nur auf einer Achse angezeigt werden, so dass wir den Indikatorwert in ein neues Attribut umwandeln müssen. 1. Indikator in Attribut umwandelnOpen-Source-Dataset. Neues Attribut vom Typ Text anlegen.
Transformiert Indikatorwerte in dieses Attribut. Für diese Option klicken Sie auf das Symbol des Transformationsskripts des neu erstellten Attributs und verwenden Sie das Transformationsskript, das einen Wert mit Indikatorwerten zurückgibt:
Weitere Informationen zum Thema Transformationsskripting finden Sie im Abschnitt Entwickler.
2. Diagramm erstellenGehen Sie nun zurück zu dem Report, der auf diesem Dataset basiert, oder erstellen Sie einen neuen Report.
Wählen Sie das Kennzeichen, das angezeigt werden soll.
Wählen Sie Drill-Down, der Indikatorwerte enthält.
XY-Diagramm wird erstellt.
3. Zusätzliche EinstellungenProblem: Quelldaten enthalten viele verschiedene Werte. Dies führt dazu, dass Werte auf der Achse mit Attribut nicht korrekt angezeigt werden.
Solution: in this case, we need to round attribute values. This should be done via transformation scripts. Proceed to mit dem Anwendungsfall mit der beschriebenen Änderung der Dezimalwerte fort.
|
Overview
Content Tools