You need to be in edit mode in order to create new view. To activate edit mode, click on "Edit" in the side menu or click on the floating Edit button. 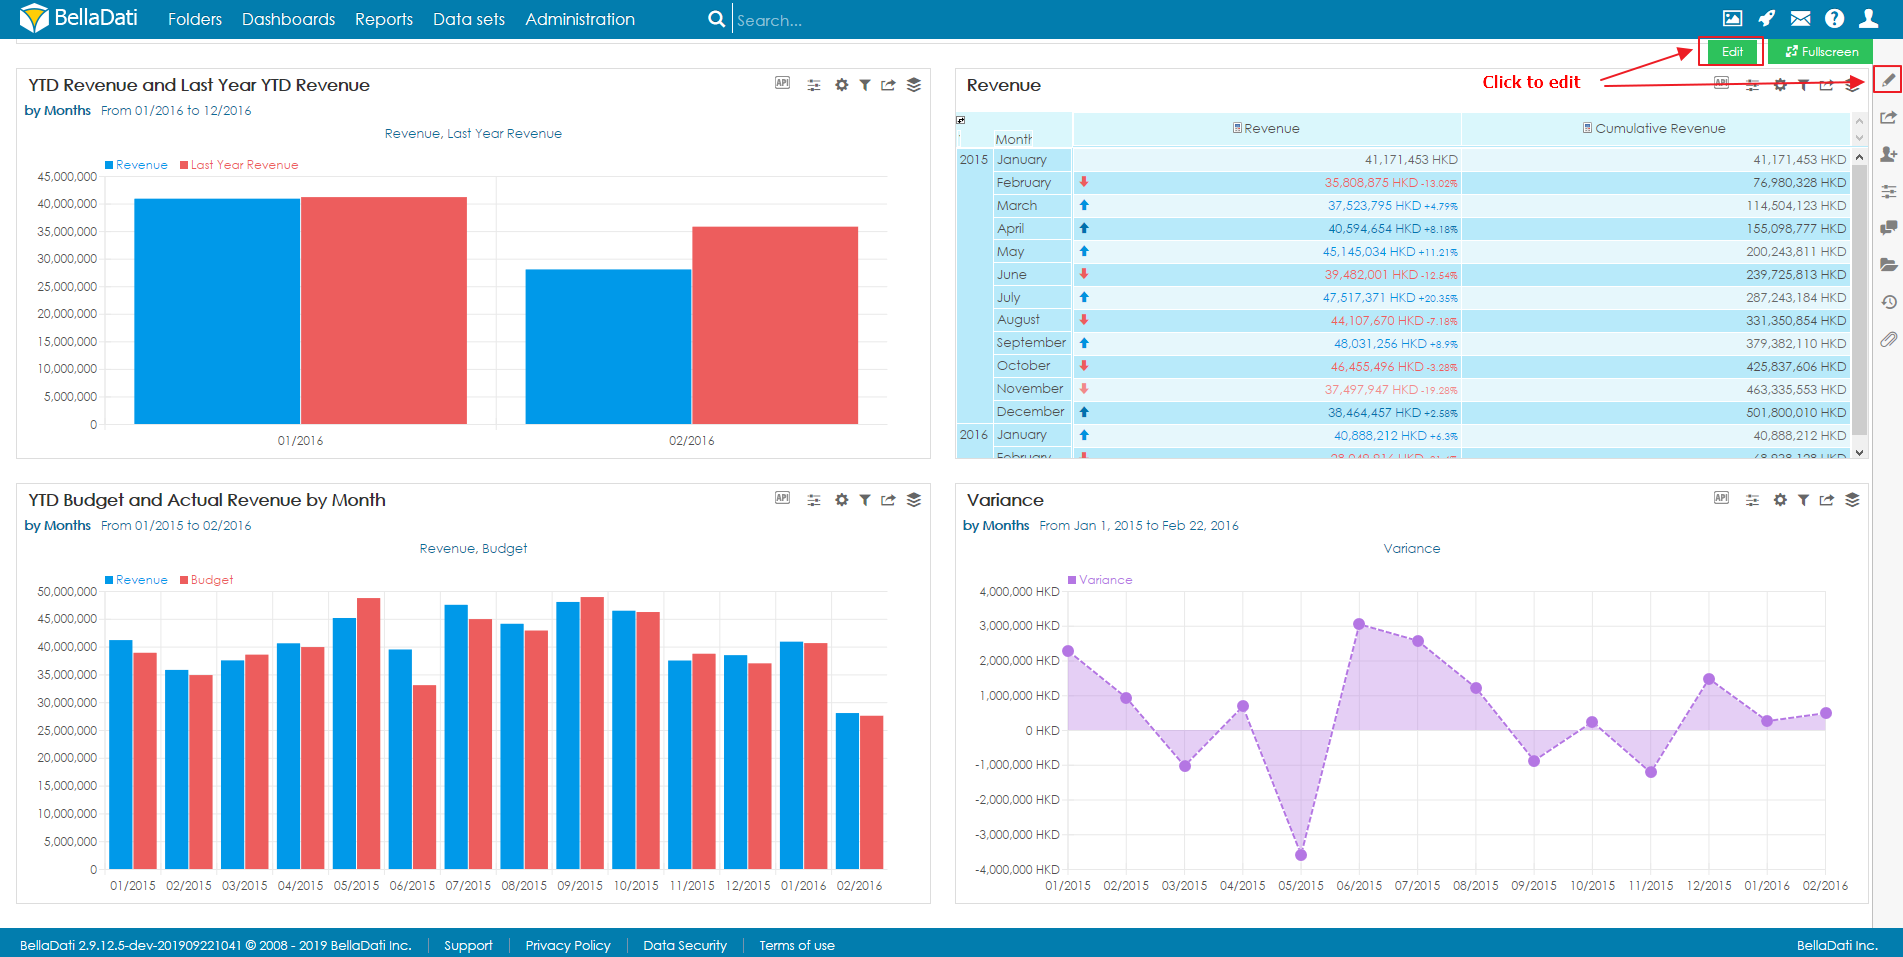
To add a new View hover over free place and click on desired View type. The Add new view dialog box will appear. 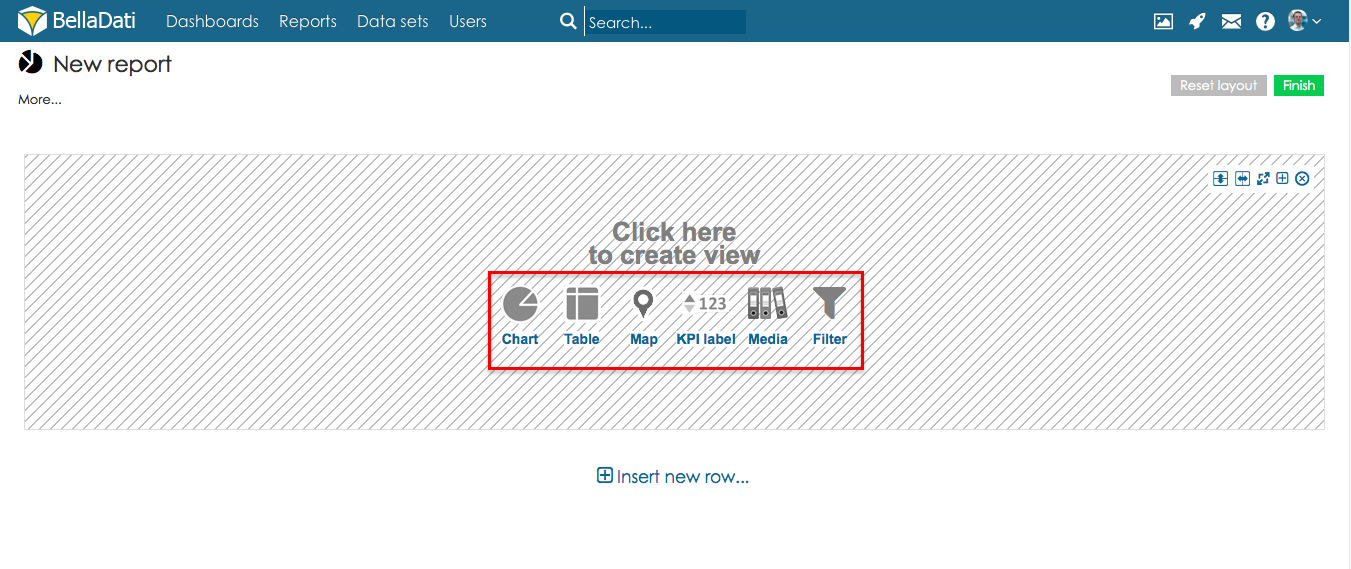
View typesBellaDati allows you to select from the following view types: | Section |
|---|
| Column |
|---|
| 
|
| Column |
|---|
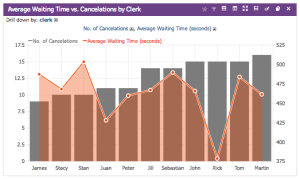
| ChartChart view offers various data visualization types.
You can specify: - Indicators displayed in the chart.
- Drill down path used to cathegorize data in more detail.
- Date interval restricting time period of displayed data
- Chart appearance
To learn more about Charts continue by Creating Chart . |
|
| Section |
|---|
| Column |
|---|
| 
|
| Column |
|---|
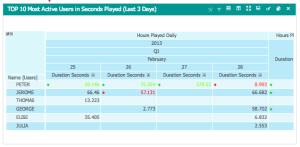
| TableTable view allows displaying data in the crosstab grid.
You can specify: - Indicators displayed in the table.
- Drill down paths used to cathegorize data in more detail.
- Date interval restricting time period of displayed data
- Table appearance
To learn more about Tables continue by Creating Table . |
|
| Section |
|---|
| Column |
|---|
| 
|
| Column |
|---|
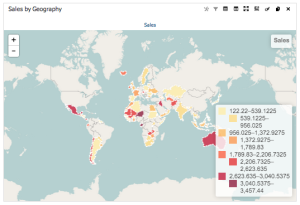
| Geo mapGeo map view offers data visualization on the interactive map.
You can specify: - Indicators displayed in the map.
- Drill down path used to cathegorize data in more detail.
- Time interval restricting time period of displayed data
To learn more about Geo maps continue by Creating Geo Maps . |
|
| Section |
|---|
| Column |
|---|
| 
|
| Column |
|---|
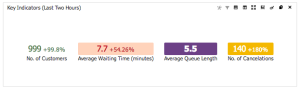
| KPI labelKPI label view allows clear monitoring of the important indicator value. You can specify: - Indicator displayed in the label.
- Time interval restricting time period of displayed data
- Label appearance
To learn more about KPI labels continue by Creating KPI labels . |
|
| Section |
|---|
| Column |
|---|
| 
|
| Column |
|---|
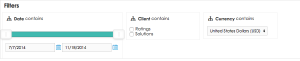
| FiltersFilter view allows you to to dynamically modify content of the report. You can also create custom components which allow report viewers to filter the report by just a few clicks. Available custom components: - Slider
- Multiple select
- List
- Check box
- Radio buttons
- Text
To learn more about filtering continue by Creating Filters.
|
|
Appearance- Show empty view - even if dataset does not have any data in it, this option will allow to display selected view
Next Steps | Related content |
|---|
|
| Content by Label |
|---|
| showLabels | false |
|---|
| max | 6 |
|---|
| showSpace | false |
|---|
| cql | label in ("view","report","chart","table","geomap","kpi","label") and space = currentSpace() |
|---|
|
|
|