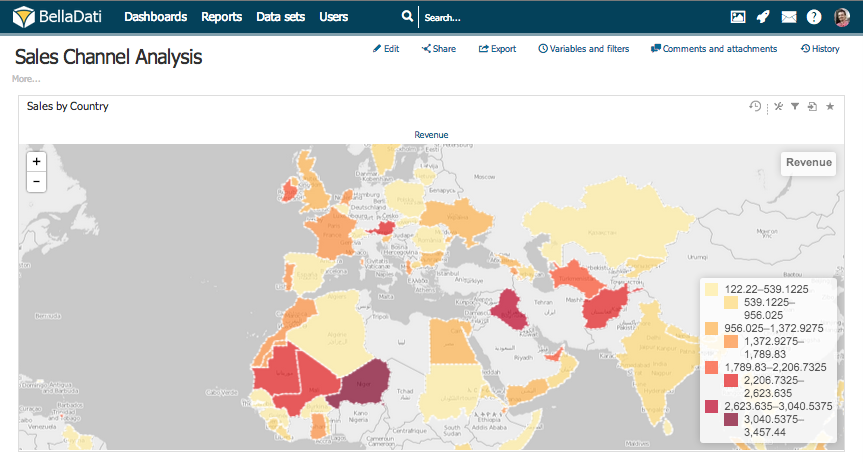
Geo maps allow you to visualize Indicators on the interactive maps. | Note |
|---|
You need to be in edit mode in order to create new Geo map. Click on "Edit" in top report menu to activate edit mode. |
To add a new Geo map, hover over Insert new row and click on Map view type. New Map dialog will appear. 
- Enter the name of the New map and select Indicators that should be displayed in the map
 - You have to add Drill down to complete the view setup. Drill down defines which attribute will be used to categorise and position data on the map (for instance Sales indicator for specific State)
 - You can select Show details for. This option will do drill-down for selected Indicator according the attributes (for instance Sales Indicator for specific State and specific Coffee Product)
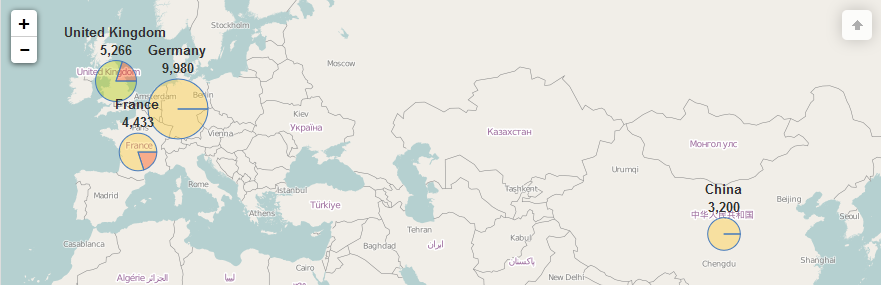
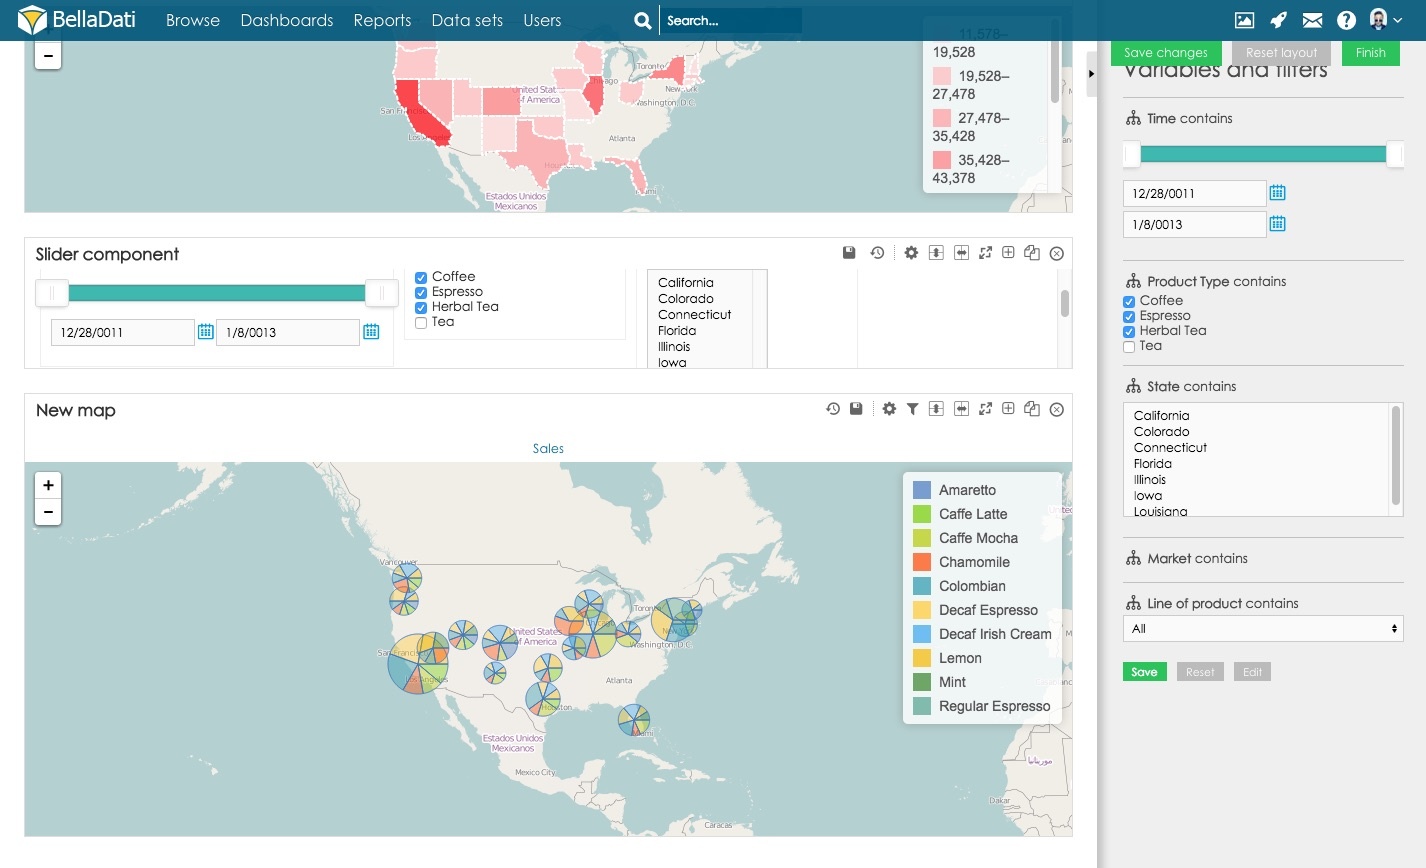 - You can enable "Show values" to display indicator values on map.
| Tip |
|---|
Example: The most common drill downs associated with Geo maps include Country, Region or City. When Country attribute is selected: - Indicators are grouped according particular country.
- Values are placed to proper position corresponding with country location.
|
Drill DownYou can specify drill down from Chart settings. To access dialog: - click on add drill down to complete the view setup link in the created view.
- enter Map chart settings dialog from the toolbox and click Add drill down path.
Custom drill down| Anchor |
|---|
| custom-drill-down |
|---|
| custom-drill-down |
|---|
|
As in chart and tables, you can set another drill down to change the granularity of map. To do so you have to specify default GEO location mapper in Attribute settings in Data Set. If it is all set, you can click on any drill down member, select Custom drill down Attribute and click on Set drill down. If Predefined drilldown (for example Country > City) is also set, it is possible to drill-down with left mouse click. Default pop-up window is then available with right click. 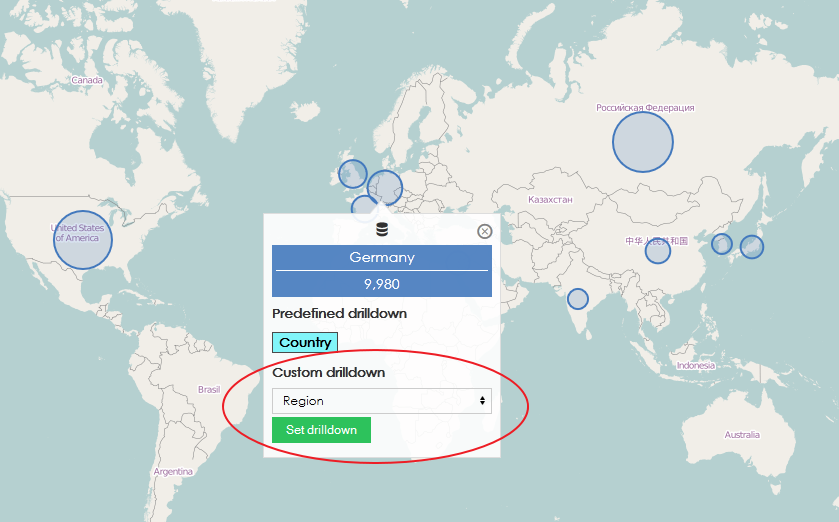
You can download video of setting custom drill down here Map settings
Map settings dialog allows you to: - Specify Attribute or GEO Point to be used for aggregating and categorizing indicator's values.
- Show details for monitored Indicator
- Select Place definition for proper positioning and visualization of data.
- Manage places definitions - continue by Managing GEO Data .
- Select desired map provider.
- Setup Limit for members in the drill down path. Displayed memebers depend on current sorting setup.
- Specify Number of colors for shape-based map. By default, BellaDati will create scale with eight colors. Users can override this setting.
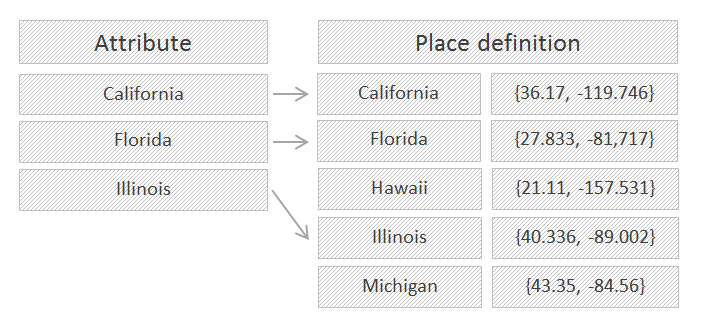
Associating Attribute with Place definitionThere is a very thin connection between drill down and place definition. While drill down maintains indicator's values and their categorization, place definition keeps pairs of location identification and its coordinates. BellaDati automatically connects attribute's members with places and therefore enables their proper positioning. | Note |
|---|
You should always select only attributes which can be associated with an existing Place definition. In case of attribute with no related Geo data, indicators will not be properly displayed. |
Drill down option allows you to define: - how displayed indicators will be grouped and categorized.
- what granularity will visualized data have.
- which mapping background will be user (Standard, Black & White, Gray Scale, Outdoors, Cyclo, etc.)

Place definition option is used to associate selected attribute with Geo data. Select Place definition according to: - Drill down path you selected.
- Style of visualization you want to apply (point vs. region).
Each Place definition includes pair on place identification and its coordinates. Coordinates can be represented as: - Points. In point definition, location is identified by pair of values representig exact longitude and latitute.
- Regions. In region definition, area is restricted with polygon, composed of set of longitude and latitude values.
For more information about Place definition continue by Managing GEO Data . Using GEO Points GEO point is a special attribute type holding latitude and longitude coordinates of a special location. GEO points are most convenient to use when location information are stored directly in imported Data Set. It automatically generated its own place definition and can be directly used in reports. To use geo points: - Select GEO point attribute in Drill-down settings
- Find relevant Point definition
- Choose desired map provider
Map managementYou can perform additional operations in upper right corner of the inserted Map view: - Table settings
- Filter setting - continue by Using Filters
- Export view - continue by Exporting View
- Add to dashboard
- Move map
- Duplicate map
- Delete map
Map settingsClick on toolbox icon to enter Map settings dialog. Map settings dialog shows Indicators and Drill down path currently applied to the map. BellaDati allows you to: - Enter indicators or drill down path dialogs.
- Remove drill down path.
- Add time axis - continue by Setting Date Interval .
- Add conditional formatting - see next paragraph.

There are two types of conditional formatting available for maps. - Conditional formatting for indicators - Displaying Indicators.
- Background color is applies for shapes and foreground color for points.
- Map conditional formatting - chosen color is applied to drill-down member whose value is smaller or equal than specified value. You can create your own color scheme by using multiple rules.

Displaying image in indicator detailsIf there is added image to the attribute member which is used in the map, this image will be also displayed in indicator details. 
Video Tutorial| Widget Connector |
|---|
| width | 853 |
|---|
| url | https://www.youtube.com/watch?v=krQU1dkiU_0&index=30&list=PL48CzuF9XMMcOBpaXoTyH1a19QF2eU94G |
|---|
| height | 480 |
|---|
|
Next Steps | Related content |
|---|
| | Wiki Markup |
|---|
{related:NumLabels=6} |
|
|