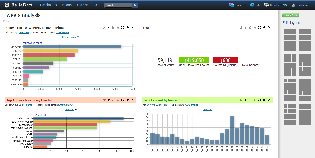
Release notes BellaDati 2.7Release date: September 21, 2012 Preview in pictures| Section |
|---|
| Column |
|---|
| 
|
| Column |
|---|
| 
|
| Column |
|---|
| 
|
|
New Features- New report layout
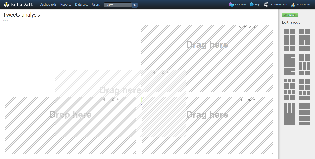
- Drag&drop report layout
- Report, Bar chart - support bar stacked chart when using drill down
- Copy table, table comments - ask user if he wants to copy comments when he try to clone a table with comments
- Conditional formating - add possibility to change priority in case of more conditions
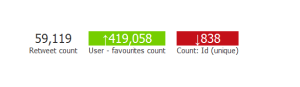
- KPI label support
- Support Coffeescript .coffee files
- Datetime and decimal format settings (report, export, data browser)
- Table - quick members filtering
- Condition: add ability to show change percentage
- Scroll to first empty space when switch to edit mode
- Member filters - add posibility to choose more conditions for one attribute
- Line chart - dotted and dashed lines support
Improvements- Improve work with layout templates
- Report, custom members - improve members settings
- Moving views to dashboard - inform user about presence of the same view on target dashboard
- Data row adding, joined data set - show new indicators (created during adding of new row in source data sets) in joined data set
- Data sources, progress bar - display import progress bar in case of external data sources
- Available date interval should be loaded with regard to view's filter
- Formula - improve context handling in time formulas
- Searching - allow to search by translated names of attributes/members/indicators
- Improve JS minimalization
- Table grid - Display sort-image only with mouse pointer over it, eventually above header
- Improve footer graphics
- Improve ajax refresh zone
- Improve form buttons graphics and accessibility
- Attachment list - break the long names of attachments
- Enable Flash Chart component to accept custom dpi for Flash rendering
- Upgrade Tapestry version to 5.3.5
- Upgrade to Joda 2.1
- UI - Unify areas which indicates empty content with new-layout-style "lined" background
- Finalize graphics of visualization report view
- Replace old autocomplete fields with newer JavaScript
- Display suitable placeholders when resizing layout
- New table comments engine
Bug fixes- Chart is not depicted complete
- Horizontal bar chart - wrong display (cut) of labels on horizontal axis (workspace only)
- Missing legend in horizontal bar chart
- Dashboard, table - only the first of two identical tables on the same dashboard reacts on drill-down operations
- Charts - Fill under the line blocks hover on underlying points
- Export - PNG export doesn't contain names of indicators
- Cumulative indicator formulas - if user wants to cumulate indicator in week time period, he must enter the first day of the week
- Data set, calendar - calendar month position is always reopened on the last opened position
- Report, line chart - custom range specification causes lines are rendered outside chart area
- Members filter, autocomplete - problem with semicolon separated values of members
- Report, table - scroll bar is not positioned correctly
- Box for editing report description is too wide
- Charts, time axis - covering of time values
- Pie chart tooltip - tooltip window displyed in the wrong place
- XML import/export: Structure backup popup halts when file downloaded
- Pie chart - Short labels are wrapped without a reason
- Popup - ESC causes AJAX errors display when loaders displayed
- Report, export - Speedometer value labels are cropped in PNG
- Speedometer chart - cropped labels on the right side of axis
- UI graphics - User drop down menu colors blue when moving through it with arrows
- UI graphics - Wrong size of text field in comments on tables.
- Report, Comments - After submitting or deleting comment, window moves to the other side of report
- Report, variable - Description and default filter settings are deleted until popus is saved
- Report, formula - Ranking function is incorrect for large members count
- XML backup - removing user or user group during the restoration settings doesn't work
- Dashboard - tables left column header is not shown
- Report, chart - Combined chart style settings are not copied properly
- Improve coffee->js compile speed
|