Base conceptsAttribute | Attributes are describing indicators, usually in a form of general terms such as "country", "department", "product", "employee", etc. Attributes consist of members (attribute values, instances) eg. "Czech Republic", "Sales Department", "Product XY", "John Smith".
For example, a Sales record could have attributes such as sales person, store, region, date, etc. | Dashboard | Dashboard typically consists of the most important tables or charts from reports and is primarily determined for managers who need quick overview of actual company situation. Special custom content can be added to every dashboard as a customization. Dashboards can also be shared for public via web. | Data set | A virtual database of BellaDati's integrated data warehouse. Each data set usually represents data with similar characteristics (e.g. invoices, wages, costs) from one data source. Data set consists of data set dates, indicators, attributes and attribute translations. Each report is build on single data set. More data sets can also be joined together. | Data set indicator | Data set indicators are defined within the data set and are available as musters for report indicators. Another settings (like aggregations, appearance, etc.) are not supported. Simply said, the data set indicators represents a raw numerical value (in the OLAP language it is a fact) with basic attributes - name, unit and rounding mode. Values of these indicators are straightforwardly stored in BellaDati's data warehouse directly from imported data. | Member / Attribute value | "Instance" of one attribute. For example, members of the "employee" attribute may be "Jan Novak", "John Smith" etc.
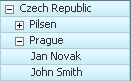 Image Modified Image Modified | Record | Particular data row stored in the data set. Each record consists of indicator values, attribute values and date/time information and has the same structure within single data set | Report | An analytic output, providing answers to user's research according to the gathered data. Each report can contain description, tags and consists of one or more views (charts and pivot tables), comments and possibly attachments. | Report indicator | Report indicators are created in the report from the data set indicators or ad hoc. Unlike the data set indicators, report indicators are supporting wide range of various settings - member aggregation, time aggregation, appearance, conditional formatting, extended formula support with report variables etc. |
Detailed glossaryTerm | Meaning |
|---|
Alarm (data watch) | Notifies data manager about changes in indicator's values in a particular data set according fulfillment of one or more predefined conditions. | Chart | Graphic representation of analytic data view. There are a lot of chart types in BellaDati - eg. line chart, pie chart, bar chart, stack bar chart, horizontal bar chart, radar chart, horizontal heat map. Each of them offers a different way how to explore particular dimensions (time, indicators and attributes). | Comments | A short message or explaining information attached to report or table cells. | Conditional formatting | Conditional formatting allows user to adjust appearance of the particular indicators in table according to currently displayed values or their changes. | Copy | A clone of the existing report, table or chart. Any future change of the copy does not affect the original report. |
Dashlet | A basic item of the dashboard. Dashlets usually represent your existing views (tables, charts) from reports. Another types of dashlets have informational, supplemental or customizing function. | Data source | Data source is typically a database, Microsoft Excel spreadsheet, text file or another services eg. Google Doc spreadsheet, Facebook or enterprise services like CRMs (SalesForce, Amiando etc.). | | Date Units | Date Units are predefined time aggregations including Day of Week, Day of Month, Day of Year, Week of Year, Month Of Year, Quarter of Year or Seconds in Minute and Minutes in Hour. | Domain | Whole virtual space of the one registered organization. Users of one domain can't access data in another domains. Domains are completely independent. Separate domains can also be suitable for individual divisions or SBUs of large international companies. | Drill-down | An operation which results in displaying more detailed data with higher granularity according to the chosen drill-down path. If you drill-down a member, you will see its child members. Eg. drill-down of particular affiliate can display its employees.
Image Modified | Drill-down path | A sequence of attributes which influences the results of the drill-down operation. It can be defined in the data set or chosen ad-hoc in the report.
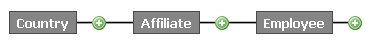 Image Modified Image Modified | Fact | Facts are equal to the data set indicators. | Filters | Filters restricts data displayed in views according to selected members only or general member match pattern. Eg. you can set filter to show only the largest cities in a table or chart. General filter settings are also available when sharing data sets. | Formula | Formula is a tool allowing user to define its own new indicators. Despite using common mathematical functions, advanced functions such as regressions or getting different values of existing indicators in time or depending on their aggregation is possible. | Geo data | Geo data are pairs of location identification and its coordinates. In BellaDati, location can be represented as point or region. While point is identified by single pair of longitude and latitude coordinates, region comprises of multiple points creating the polygonal area. | | Geo point | Geo point is one of the attribute types. It holds information about latitude and longitude coordinates and can be used in Geo Map view type to plot data into its particular location. Alternative to Geo points are separately maintained Geo Data. | Group of indicators | Group of indicator consists of one or more included indicators which have the same context (eg. wage components). Users can effectively work with the whole group like with a single indicator. | iFrame | iFrame is a feature, which allows users to embed their analytic views into the external website using HTML code. | Joined data set | An abstract data set, which represents data from two or more source data sets. This allows user to analyze mutual dependencies of data from different data sources or can easily assign member IDs to their names (codebook). Data sets can be connected together according specified condition - inner, outer or cross join. Joined data set reflects all the changes in the source data sets. | Member aggregation | Specifies the way, how the repeating data records of one member are aggregated (in one time unit). The aggregation possibilities are: sum, average, minimum, maximum and count (of different members). | Metric | Metrics are equal to the report indicators. | News | Dashlet, which shows actual and former changes mainly in reports and data sets within the domain. This dahlet also displays information about the author of those changes. | Pivot table | An analytic view in a form of flexible rows and columns. Users can adjust, what should be displayed on each axis (various attributes, indicators or time units) and choose the structure of the drill-down path for the current table. It is also possible to analyze indicators in pivot table through the conditional formatting. | Predefined import | Predefined import is a tool, which allows users to easily load columns settings from the first import during repeated imports. | Query Scheduler | A tool, which allows to schedule and control regular data synchronization. It's main purpose is to update data warehouse with actual data from data sources. | Roll-up | An operation, which displays less detailed data with lower granularity according to the chosen drill-down path. It's an inverse operation to drill-down. | Sample data | A set of predefined content, consisting of reports, dashboards, data sets and predefined imports. | Sharing | Sharing is a feature, which allows collaboration and cooperation among users. It's possible to share your data sets, reports or dashboards with other users in the same domain. You can also choose to delegate permission to edit your data sets and reports. Besides iFrame and iGoogle are another sharing tools, which allows you to share your views on corporate intranet or publicly via Internet. | | Subset | Subset is a virtual copy of Attribute which holds only desired members. Subsets members can have custom order. | Time aggregation | Specifies the way, how time units with higher granularity are aggregated in the units with lower granularity. If you (for example) gather data in days but display them in months, the time aggregation determines if the "month" units show sum, average, maximum, minimum or count of the included day records. | | Time Series | Time Series in another way of date aggregation. In contrast to Date Units, it aggregates values but displays them on continuous time axis. | | Translation | Is one of the Data Set column type. It holds language translation of Attribute members (values). | User group | A set of individual users. The Domain administrator has a right to create, delete or edit these groups. He also adds new users to groups, remove users from groups and assigns user roles to the groups. User group is a very useful tool, because users can share their reports or data sets with the whole group instead of choosing of all its individual members. | User roles | User roles are designed to separate access to different functions for different types of users. Available user roles are "Domain administrator", "Report editor" and "Data manager". These roles can be combined without any restrictions. Only the Domain administrator has a right to delegate those roles to other users. | View | Basic element of the report - displays values of the indicators depending on user's criteria. Views represent flexible points of view to the user's data in a form of pivot table, chart or possibly custom content. Views allow you to use the "slice and dice" features. |
|