Versions Compared

Key

  • This line was added.
  • This line was removed.
  • Formatting was changed.
Comment: Removed translated content for 'zh'
Sv translation
languageen
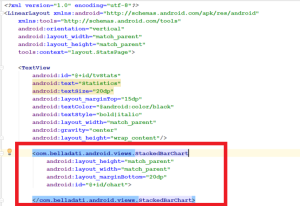
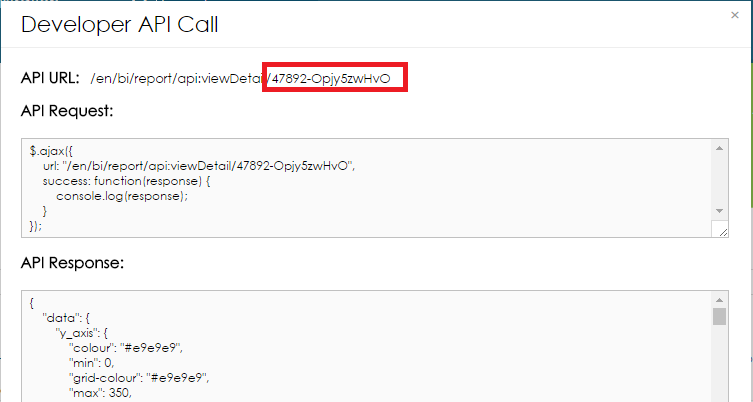
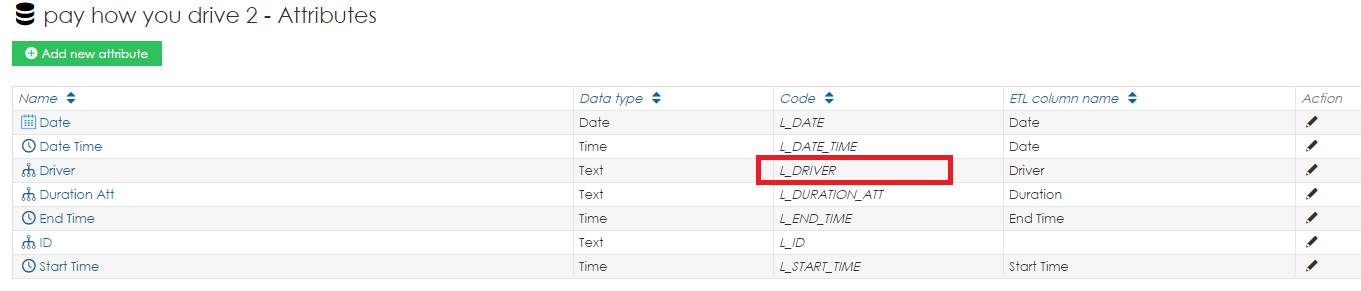
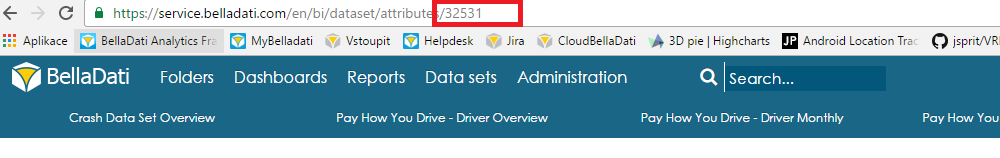
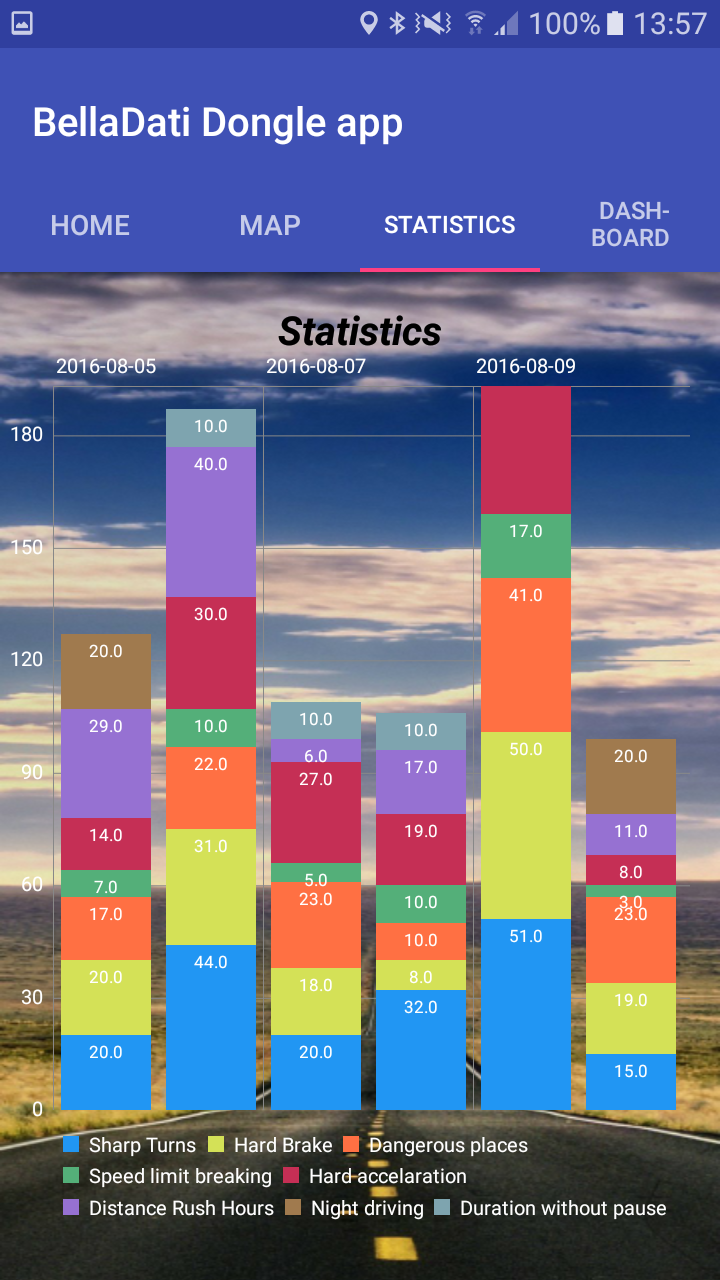
This is example of how we have implemented the android mobile app in BellaDati using BellaDati-android-views library. You can use the native components of this library to visualize charts, KPIs and tables.


Tip
The data to visualize are from BellaDati reports. See the Report section in order to learn how to setup the report.


Tip
First of all you have to use android-sdk to implement xAuth or oAuth. See section Java SDK --> Android.

List of the components

  • Bar chart
  • Line chart
  • Pie chart
  • Stacked bar chart
  • Table
  • Kpi


How to use the BellaDati-android-views library

  1. Modify build.gradle (project) add the following lines to repositories section. It should look like:

    Code Block
    languagejava
    allprojects {
        repositories {
            jcenter()
            maven { url "https://jitpack.io" }
        }
    }
  2. Modify build.gradle (app) add one line to dependencies section.

    Code Block
    languagejava
    compile 'com.belladati:belladati-android-views:1.4'
  3. Implement xAuth to BellaDati. See section Java SDK --> Android. Once you get instance of BellaDatiService, you can use the BellaDati-android-views library.
  4. Modify layout.xml which you want to use. For example, we can create a StackedBarChart. See sample code below.


  5. We added com.belladati.android.views.StackedBarChart and set its height, width and id.
  6. In corresponding Java class, implement the onCreateView(..) method and get the instance of desired chart. In our case, StackedBarChart.

    Code Block
    languagejava
    StackedBarChart myChart = (StackedBarChart) rootView.findViewById(R.id.chart);
  7. Now you can call methods of StackedBarChart instance. First of all you have to set BellaDatiService and ID of the chart. Instance of BellaDatiService is returned by xAuth. ID of the chart chart is the ID available in BellaDati. You can get the chart ID over the REST API, Client API or manually in Developers mode:

    Code sample:

    Code Block
    languagejava
    myChart.setService(service);
    myChart.setIdChart(“47892-Opjy5zwHvO”);
  8. Optionally, you can use MultiValueFilter to set filtering of the view. For example:

    Code Block
    languagejava
    Filter.MultiValueFilter fUserId;
    fUserId = FilterOperation.IN.createFilter(getAttribute("L_DRIVER", "32531"));
    fUserId.addValue(new FilterValue("D1654"));
     
    ObjectNode filterNode = new ObjectMapper().createObjectNode();
    filterNode.setAll(fUserId.toJson());
     
    mChart.setFilterNode(filterNode);

    Below is method getAttribute(..)

    Code Block
    languagejava
    private Attribute getAttribute(String filter, String idDataset) {
        for (Attribute aa : service.loadDataSet(idDataset).getAttributes()) {
            if (filter.equalsIgnoreCase(aa.getCode())) {
                return aa;
            }
        }
        return null;
    }


    First parameter of getAttribute(..) is the code of the data set Attribute which you want to filter and second is ID of data set. See below. FilterValue parameter is value what do you want to filter. You can also filter for more parameters like date etc. 

    Getting the data set ID:

  9. The last step is calling the method createStackedBarChart(), which basically renders the chart.

    Code Block
    languagejava
    try {
        mChart.createStackedBarChart();
    } catch (Exception e) {
        Log.e("error",e.getMessage());
    }
  10. Now you have chart in your mobile app. There are few more options to setup your chart: Axis text color, Legend text color, Value text color etc. 

    Info
    Charts are zoom-able and you can move on x-axis and y-axis.


Sv translation
languageja

これは、BellaDati-android-viewsライブラリを使用して、BellaDatiにAndroidモバイルアプリを実装した例です。このライブラリのネイティブコンポーネントを使用して、グラフKPIを視覚化できます。


Tip

視覚化するデータはBellaDatiレポートからのものです。レポートの設定方法については、[Reports]セクションをご覧ください。


Tip

まず、android-sdkを使用してxAuthまたはoAuthを実装する必要があります。Java SDKセクションを参照してください。

コンポーネントのリスト

  • 棒グラフ
  • 折れ線グラフ
  • 円グラフ
  • 積み上げ棒グラフ
  • KPI

 BellaDati-android-viewsライブラリの使用方法

  1. build.gradle (プロジェクト)を変更して、リポジトリセクションに次の行を追加します。次のようになります:

    Code Block
    languagejava
    allprojects {
        repositories {
            jcenter()
            maven { url "https://jitpack.io" }
        }
    }


  2. build.gradle (app)を変更して、 依存関係セクションに1行追加します。

    Code Block
    languagejava
    compile 'com.belladati:belladati-android-views:1.4'


  3. xAuthをBellaDatiに実装します。Java SDKセクションを参照してください。 BellaDatiServiceのインスタンスを取得すると、BellaDati-android-viewsライブラリを使用できるようになります。
  4. 使用するlayout.xmlを変更します。例えば、StackedBarChartを作成できます。以下のサンプルコードを参照してください。


  5. com.belladati.android.views.StackedBarChartを追加し、高さ、幅、IDを設定します。
  6. 対応するJavaクラスで、onCreateView(..)メソッドを実装し、目的のグラフのインスタンスを取得します。この例では、StackedBarChartです。

    Code Block
    languagejava
    StackedBarChart myChart = (StackedBarChart) rootView.findViewById(R.id.chart);


  7. これで、StackedBarChartインスタンスのメソッドを呼び出すことができます。まず、BellaDatiServiceとチャートIDを設定する必要があります。 BellaDatiServiceのインスタンスはxAuthによって返されます。チャートIDはBellaDatiで利用可能なIDです。チャートIDは、REST APIClient APIを介して、または開発者モードで手動で取得できます:

    コードサンプル:

    Code Block
    languagejava
    myChart.setService(service);
    myChart.setIdChart(“47892-Opjy5zwHvO”);


  8. オプションで、MultiValueFilterを使用してビューのフィルタリングを設定できます。例えば:

    Code Block
    languagejava
    Filter.MultiValueFilter fUserId;
    fUserId = FilterOperation.IN.createFilter(getAttribute("L_DRIVER", "32531"));
    fUserId.addValue(new FilterValue("D1654"));
     
    ObjectNode filterNode = new ObjectMapper().createObjectNode();
    filterNode.setAll(fUserId.toJson());
     
    mChart.setFilterNode(filterNode);

    以下はgetAttribute(..)メソッドです

    Code Block
    languagejava
    private Attribute getAttribute(String filter, String idDataset) {
        for (Attribute aa : service.loadDataSet(idDataset).getAttributes()) {
            if (filter.equalsIgnoreCase(aa.getCode())) {
                return aa;
            }
        }
        return null;
    }


    getAttribute(..)の最初のパラメーターは、フィルタリングするデータセット属性コードであり、2番目はデータセットIDです。下記参照。 FilterValueパラメーターは、フィルター処理する値です。日付など、より多くのパラメーターをフィルタリングすることもできます。

    データセットIDの取得:

  9. 最後のステップは、基本的にグラフをレンダリングするcreateStackedBarChart()メソッドを呼び出すことです。

    Code Block
    languagejava
    try {
        mChart.createStackedBarChart();
    } catch (Exception e) {
        Log.e("error",e.getMessage());
    }


  10. これで、モバイルアプリにグラフが表示されます。グラフを設定するためのオプションは他にもいくつかあります: 軸のテキストの色、凡例のテキストの色、値のテキストの色などです。

    Info

    グラフはズーム可能であり、x軸とy軸で移動できます。