Page History
...
- To add a new Histogram hover over free place and click on Chart view type and select Histogram.
- Add name of the chart.
- Add one or more indicators - each indicator will be displayed as separate histogram.
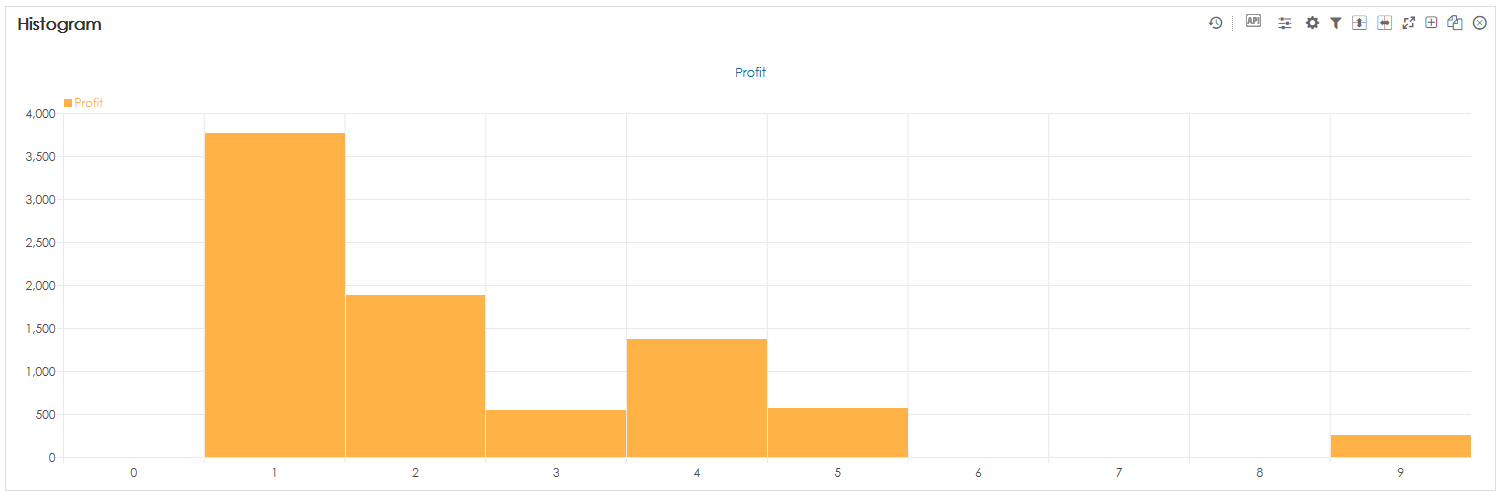
- For each indicator, you can change the appearance - mainly number of bins (n) and other standard settings of charts. The resulting chart will display (n+2) bins.
- Finish by clicking on OK.
Overview
Content Tools