This is example of how we have implemented the android mobile app in BellaDati using BellaDati-android-views library. You can use the native components of this library to visualize charts, KPIs and tables.
The data to visualize are from BellaDati reports. See the Report section in order to learn how to setup the report.
First of all you have to use android-sdk to implement xAuth or oAuth. See section Java SDK --> Android.
List of the components
- Bar chart
- Line chart
- Pie chart
- Stacked bar chart
- Table
- Kpi
How to use the BellaDati-android-views library
Modify build.gradle (project) add the following lines to repositories section. It should look like:
allprojects {
    repositories {
        jcenter()
        maven { url "https://jitpack.io" }
    }
}
Modify build.gradle (app) add one line to dependencies section.
compile 'com.belladati:belladati-android-views:1.4'
- Implement xAuth to BellaDati. See section Java SDK --> Android. Once you get instance of BellaDatiService, you can use the BellaDati-android-views library.
- Modify layout.xml which you want to use. For example, we can create a StackedBarChart. See sample code below.
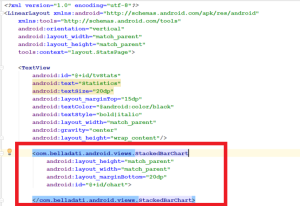
- We added com.belladati.android.views.StackedBarChart and set its height, width and id.
In corresponding Java class, implement the onCreateView(..) method and get the instance of desired chart. In our case, StackedBarChart.
StackedBarChart myChart = (StackedBarChart) rootView.findViewById(R.id.chart);
Now you can call methods of StackedBarChart instance. First of all you have to set BellaDatiService and ID of the chart. Instance of BellaDatiService is returned by xAuth. ID of the chart chart is the ID available in BellaDati. You can get the chart ID over the REST API, Client API or manually in Developers mode:
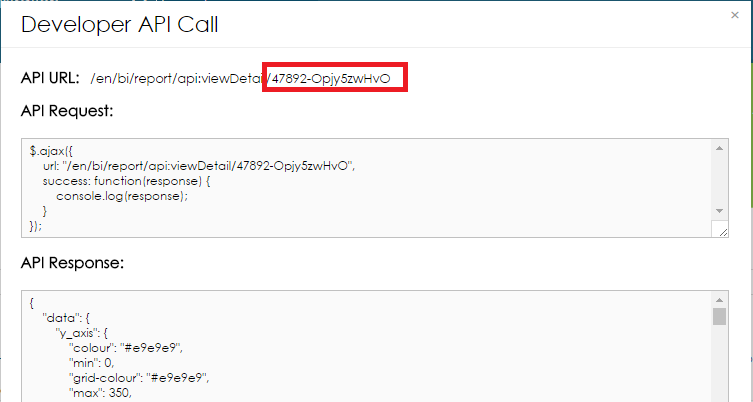
Code sample:
myChart.setService(service);
myChart.setIdChart(“47892-Opjy5zwHvO”);
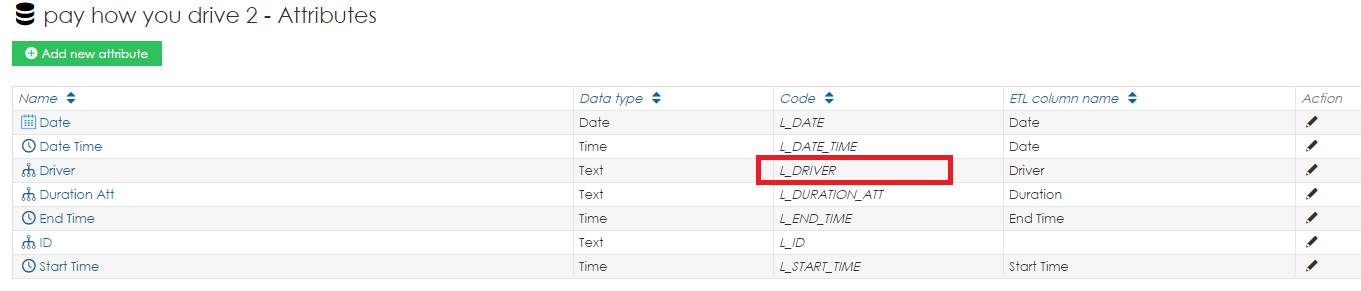
Optionally, you can use MultiValueFilter to set filtering of the view. For example:
Filter.MultiValueFilter fUserId;
fUserId = FilterOperation.IN.createFilter(getAttribute("L_DRIVER", "32531"));
fUserId.addValue(new FilterValue("D1654"));

ObjectNode filterNode = new ObjectMapper().createObjectNode();
filterNode.setAll(fUserId.toJson());

mChart.setFilterNode(filterNode);
Below is method getAttribute(..)
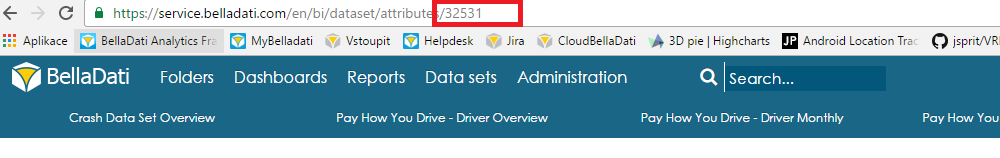
private Attribute getAttribute(String filter, String idDataset) {
    for (Attribute aa : service.loadDataSet(idDataset).getAttributes()) {
        if (filter.equalsIgnoreCase(aa.getCode())) {
            return aa;
        }
    }
    return null;
}
First parameter of getAttribute(..) is the code of the data set Attribute which you want to filter and second is ID of data set. See below. FilterValue parameter is value what do you want to filter. You can also filter for more parameters like date etc.
Getting the data set ID:
The last step is calling the method createStackedBarChart(), which basically renders the chart.
try {
    mChart.createStackedBarChart();
} catch (Exception e) {
    Log.e("error",e.getMessage());
}
Now you have chart in your mobile app. There are few more options to setup your chart: Axis text color, Legend text color, Value text color etc.
Charts are zoom-able and you can move on x-axis and y-axis.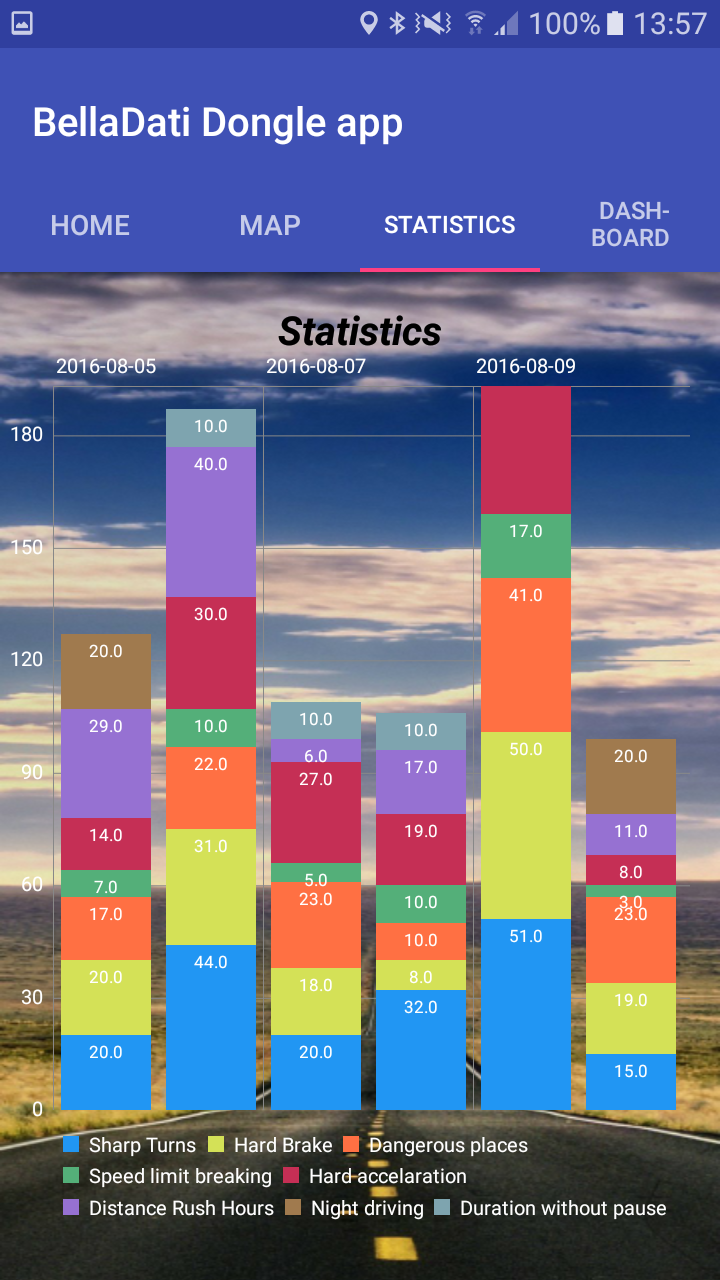
Overview
Content Tools