Released in September 2011.
The most important parts of release notes:
New features
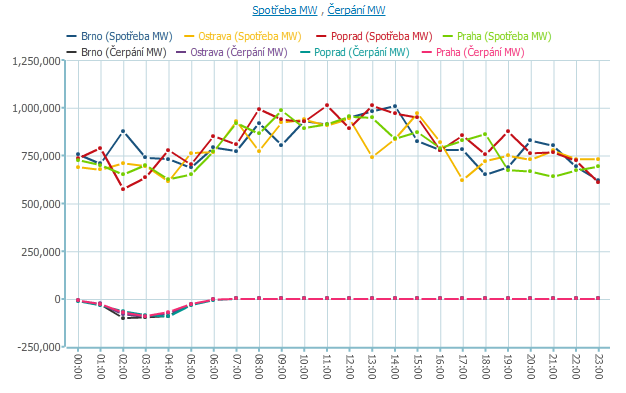
Hours, minutes and seconds support in date/time intervals
Complete support for handling time entries was added. Import data detailed up to seconds level, use time functions in formulas, edit imported time entries. Aggregation levels can be set separately for chosen date and time intervals. Display of time is fully localized.
You can create data views with standard date axis and with additional time drill down with this new feature.
Support for data without time definitions
BellaDati now handles both data with date/time flags and without time range, question forms for example. The import wizard enables to upload data without date/time column and simplifies the settings of charts and tables, which does not need time range settings for this kind of data.
Combination of chart types
Do you need mixture of bars and lines in one chart? The BellaDati 2.5 release provides „Combined chart" to setup different chart types for each indicator.

If you use Combined chart type, you find the settings of each chart type in the indicator's appearance form. BellaDati adjusts the axis range to fit all your values in both charts.
Icon/Color appearance settings for tables and charts
Boost your views with colors, make the visualizations more clear! BellaDati now supports color and icon settings for member cells in tables and color for members in charts. BellaDati keeps the same color for each drilldown members in the data set.
You can access the color and icons settings form both from data set page and report members settings.
More advanced appearance settings (mixing the colors for indicators, sums and drill-downs) are planned in next versions of BellaDati.
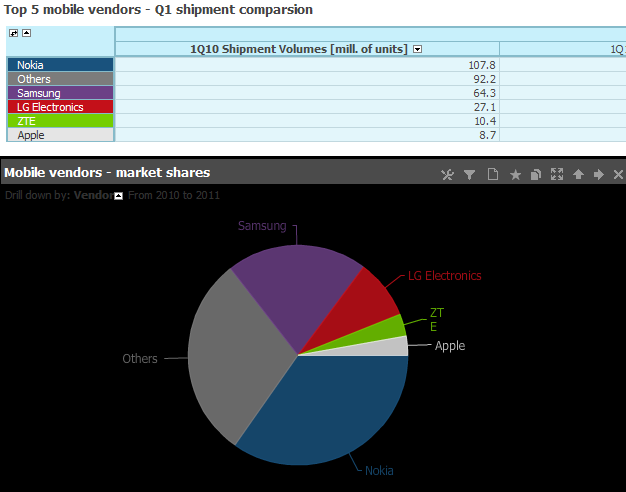
All types of charts now handles properly several combination of color settings (indciator, drill down members) and can generate suitable colors for undecorated items to make the view even more attractive.
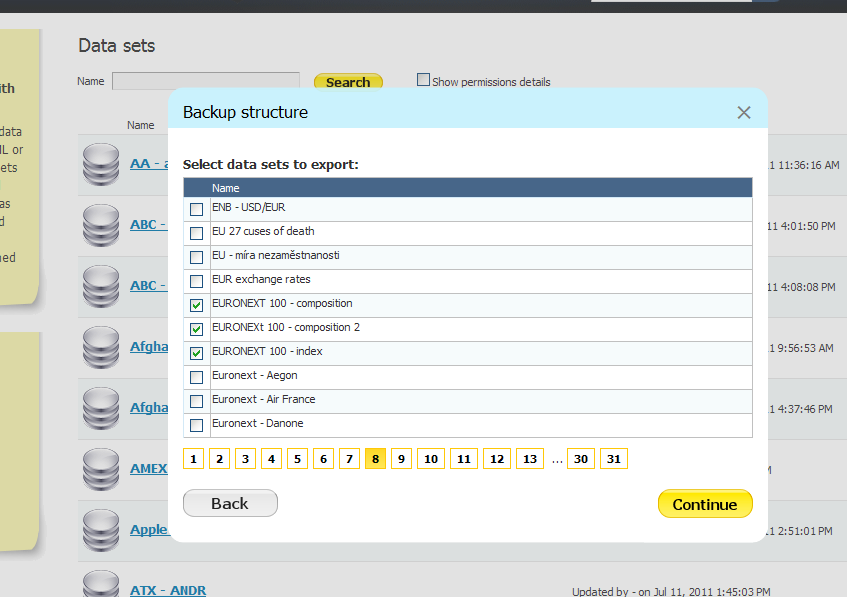
Data set structure XML backup and restore
Copy and backup your data sets without an afford to XML. The XML markup was designed to be human readable and can be also edited by automated scripts, which is a great news for developers and administrators.
BellaDati opens a brand new way to prepare data set setup with a large amount of indicators via XML file and answer to request for data set copying feature.
In combination with data CSV export you can backup your BellaDati domain completely and restore it anytime.
Transformation scripts reusing
Preparation of transformation scripts is rather a developer's work. Common users can now reuse existing/prepared scripts in dataset without writing a line. You can browse predefined scripts by another users of the data set and re-use them.
Data-set level permissions by filter
BellaDati now supports advanced user permissions to help organizations with more komplex data policy to control data drilldown levels and members access. You can limit certain department to view only data from its teams by setting one simple filter, however the management can view data from all departments.
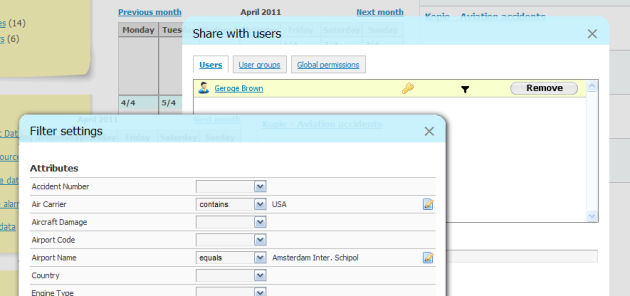
Data set owner or administrator can limit users of the reports to see only certain drilldown levels. BellaDati applies these rules immediatelly to all reports viewed by this user – both existing and created in future.
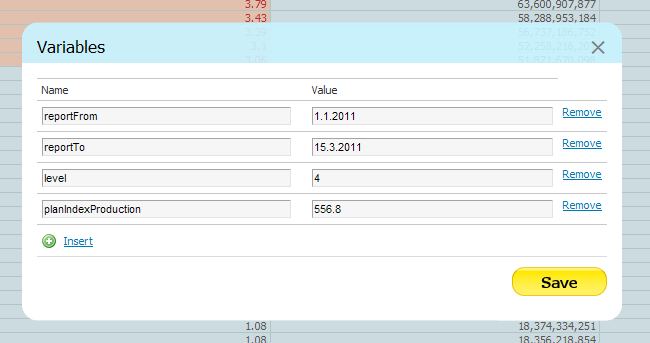
Using global report variables
You can use report-level variables in report views formulas to enable customization of all views at once. Substitute values in time ranges to simplify data browsing in the whole report.
You can also use variables to implement currency indexes and plan constants.
CSS styling for exported views
Customize embedded charts and tables with CSS. Make BellaDati visualizations fit into design of your intranet, employee portal, data-journalism blog or wherever you want interactive data.
The feature is accessible via adding a simple attribute &css=linkToYourCSS.css to the iframe URL.
Sorting indicators in charts
We continue improving the ad-hoc functions for data analysis and visualization. We introduce sorting for all types of charts after release of the indicator sorting in tables.
Improvements and bug fixes
OLAP Core speed-up
The data-analysis core of BellaDati is another step further. We radically improved the speed of query analyzing and query parsing. More complex reports with sum rows and are up to 400% faster.
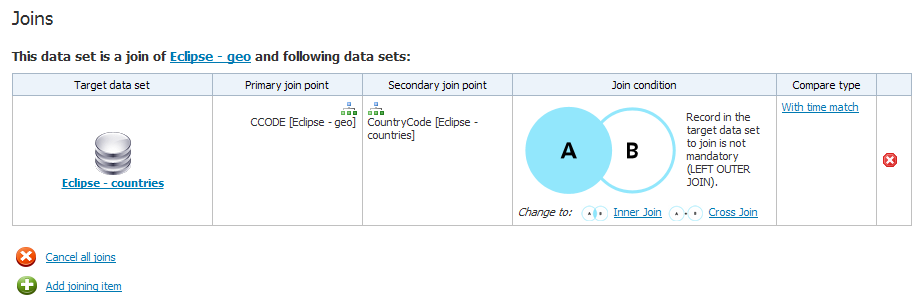
Improved data set join wizard
Data set joins are one of the most advanced warehouse tools in BellaDati. Several changes were made to provide interface for preparing and modifying joins without databases knowledge.
More precise table exports
Export wizard of views and report is simpler although many improvements have been done: XLS export of all tables in report, table PNG export, custom DPI for PNG exports. You find all view's export channels (PDF, XLS, ONG embedding) in one place after clicking to export symbol.
We also added algorithms to PDF exports to cut and place table views more naturally.
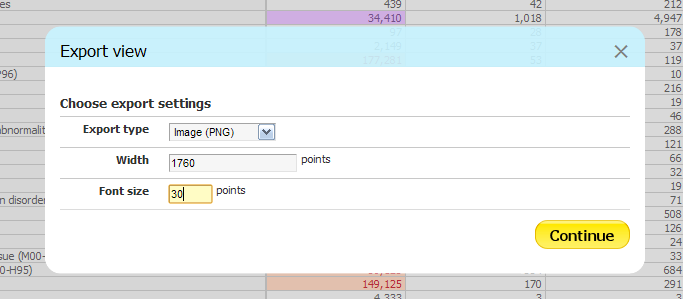
Chart multi-column layout
Many users were contacting our support with a simple question: How I can arrange the layout of the multiple indicators view with more charts for each indicator? We added a field to enable multi-column layout for such chart views, you find it in the chart view appearance settings.
Thanks to this improvement, you have more control over the report layout and can arrange the views more precise.
Chart multi-column layout does not affect exports.
Improved quality of charts renderers
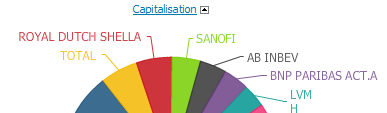
Users could meet sometimes an inaccuracy in rendering pie charts (overlapping labels, unsuitable grouping). Pie chart rendering core was re-implemented and works more precise and has advanced decision algorithms for placing labels and pie segments.
Data source page, reports summary
We added several shortcut links and buttons all over BellaDati to speed-up the common work flow. Explore data set or user profile which contains extended list of reports.
Overview
Content Tools