No Translation available yet
You have Slovak selected as language but this page has not been translated yet. Translate the page or view the content in the default space language below.
Display default
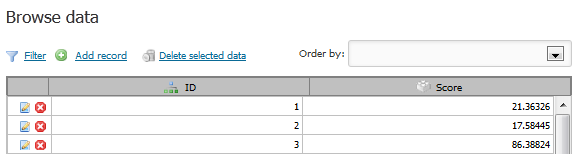
For this tutorial, we will leverage Data Set loaded with exam scores.
Data set includes two columns:
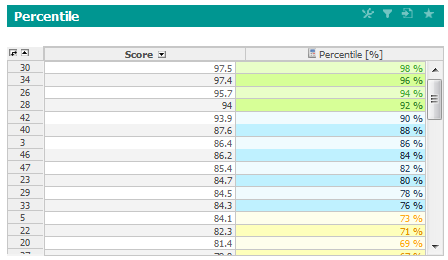
Percentiles
You desire to create table showing percentile next to score for each student.
- Create new table with student ID drill-down and Score indicator.
- Create new indicator - Percentile.
- Add following formula into Indicators settings.
- Setup percentage to Unit and associate it with appropriate Format.
int records = aggregatePrevLevel(1){L_ID_COUNT}
int rank = rank() {M_SCORE}
double percentile = 1-(rank/records)
return percentile
- line: Store the number of total records (students). Since, student drill-down is used, aggregation one level up is needed.
- line: Obtain rank for each record.
- line: Recalculate rank to percentile. For example, if rank is 5 from 100 students, the percentile will be: 1-(5/100) = 95%.
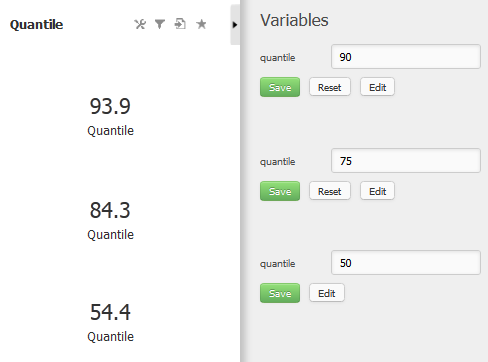
Quantiles
You desire to create KPI label showing the median of exam scores.
- Create new KPI label.
- Create new indicator - Quantile.
- Add following formula into Indicators settings.
- Create quantile variable, to be able to dynamically change observed quantile.
int records = L_ID_COUNT
double groups = 100/@quantile
int key = round(records-records/groups)
double median = 0
membersSum('L_ID'){
  rank = rank(){M_SCORE}
  if (rank == key){
  	median = M_SCORE
  }
}

return median
- Use first three lines to convert provided quantile variable and find the corresponding position within the set of scores.
- Obtain rank for each score, aggregated to the level of student's ID.
- If the current rank equals the position, store score to the median variable.
Next Steps