No Translation available yet
You have Slovak selected as language but this page has not been translated yet. Translate the page or view the content in the default space language below.
Display default
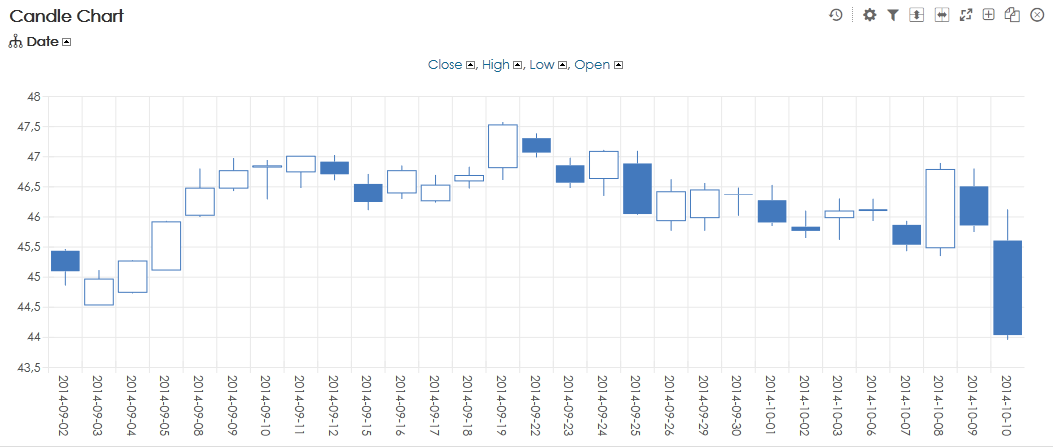
A Candlestick Chart is a financial chart used to describe price movements during time.There are four basic values that describe each candle: the open, the close, the high and the low. Therefore in BellaDati these four indicators and a Date attribute have to be present in data set.
- To add a new Candlestick Chart hover over free place and click on Chart view type and select Candlestick chart.
- Add name of the chart and specify Time interval if needed - continue by Setting Date Interval .
- Add four indicators to chart and click OK.
- Asign these indicators to correct values: the open, the close, the high and the low.
- Add drill-down by Date
- Finish by clicking on OK.