You need to be in edit mode in order to create new chart. Click on "Edit" in top report menu to activate edit mode.
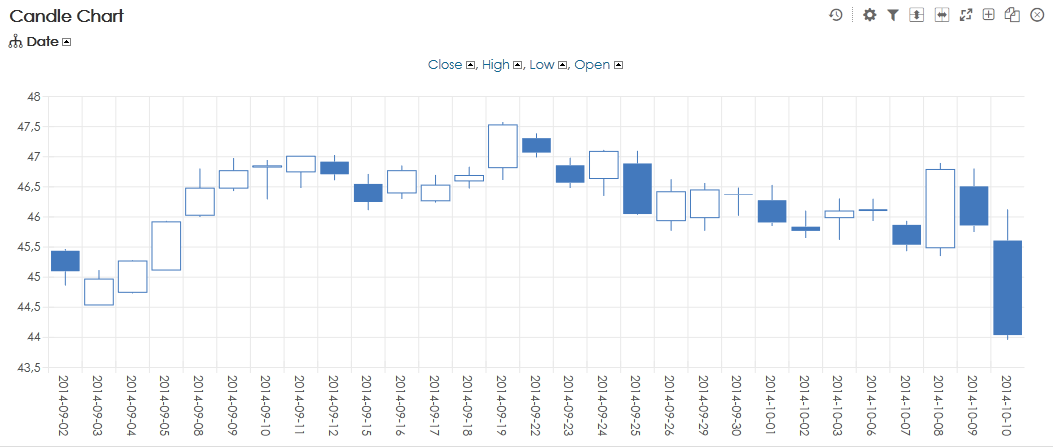
A Candlestick Chart is a financial chart used to describe price movements during time.There are four basic values that describe each candle: the open, the close, the high and the low. Therefore in BellaDati these four indicators and a Date attribute have to be present in data set.
- To add a new Candlestick Chart hover over free place and click on Chart view type and select Candlestick chart.
- Add name of the chart and specify Time interval if needed - continue by Setting Date Interval .
- Add four indicators to chart and click OK.
- Asign these indicators to correct values: the open, the close, the high and the low.
- Add drill-down by Date
- Finish by clicking on OK.
Overview
Content Tools