You have Slovak selected as language but this page has not been translated yet. Translate the page or view the content in the default space language below.
You need to be in edit mode in order to create new chart. Click on "Edit" in top report menu to activate edit mode.
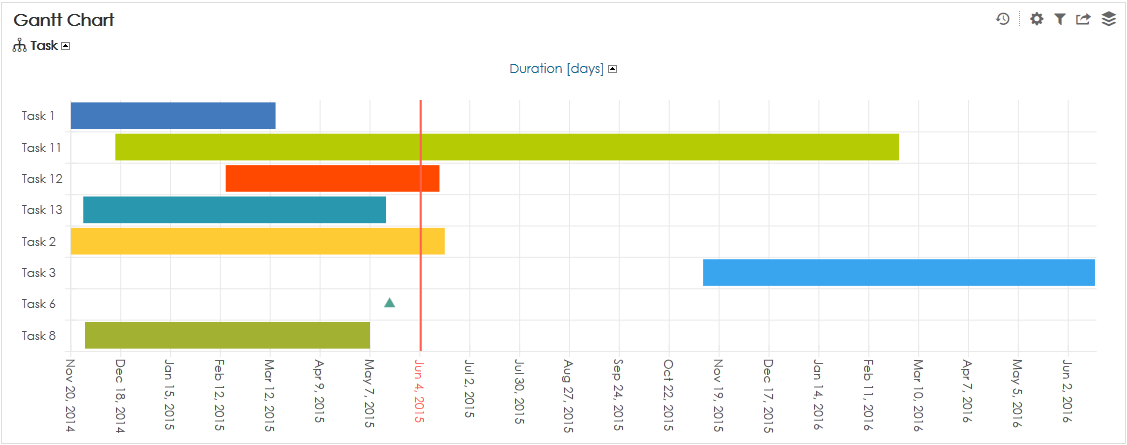
Gantt chart illustrates the start and finish dates of elements (tasks) of a project. When this is In BellaDati there are two ways how display tasks in Gantt Chart:
Task is specified by Start Date and Length of the task.
Task is specified by Start Date and End Date.
Task without duration (0 days) is displayed as milestone (triangle).
Date or datetime can be used to define tasks.
Task specified by Start Date and Length of the task
To add a new Gantt Chart hover over free place and click on Chart view type and select Gantt chart.
Add name of the chart and specify Time interval if needed - continue by Setting Date Interval.
Add an indicator which specifies length of the task.
Select Start Date attribute.
Finish by clicking on OK.
Task specified by Start Date and End Date
To add a new Gantt Chart hover over free place and click on Chart view type and select Gantt chart.
Add name of the chart and specify Time interval if needed - continue by Setting Date Interval.
Select Start Date attribute.
Select End Date attribute.
Enable "".
Finish by clicking on OK.
Specific features for Gantt chart
Appearance
Under chart appearance you can enable Zoom. That will display +- icons in right bottom corner.
Axis values at the top moves time axis at the top of chart.
Chart settings
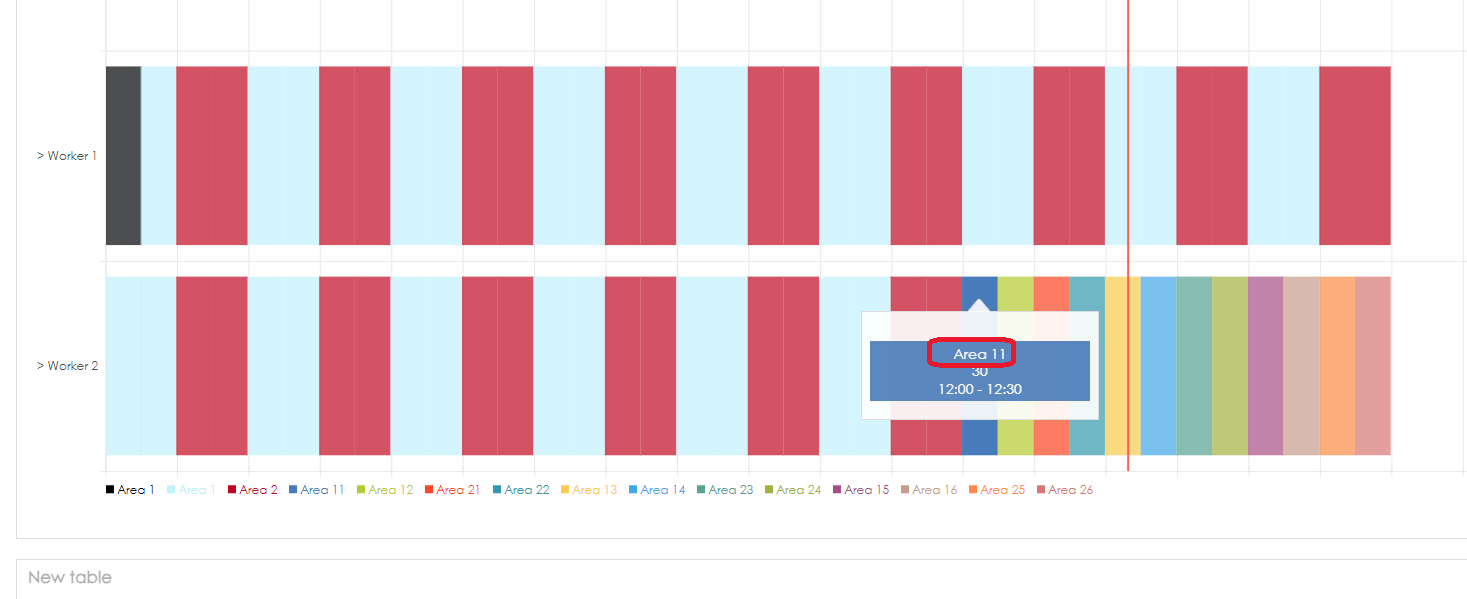
Work item drilldown: when you hover on any task, detailed drilldown information is displayed in title
Bar URL: when you click on any task, modal box will open with set URL address
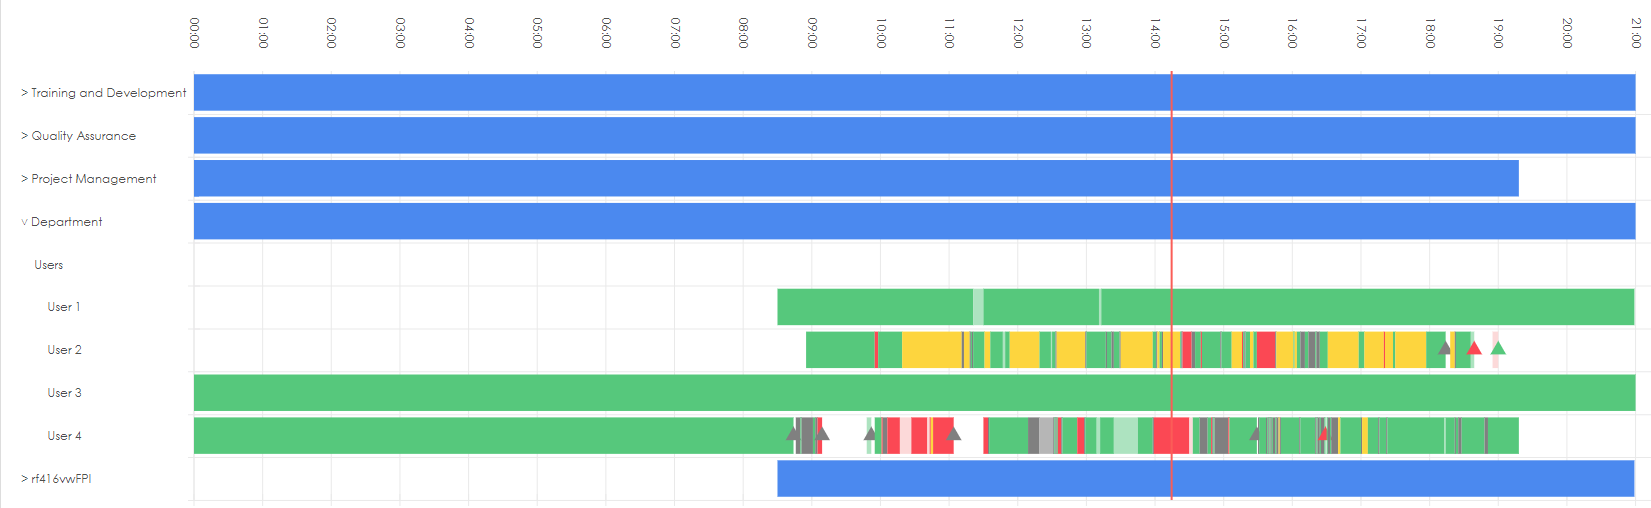
Drill down path
If your work item attribute has set drill down path in dataset settings, you will be able to expand attribute item with additional information from your drill down path. Attribute names will have small arrow next to it, indicating possible expand.