No Translation available yet
You have Slovak selected as language but this page has not been translated yet. Translate the page or view the content in the default space language below.
Display default
There are cases that you want your chart x-axis to display number of days for a particular event, rather than the calendar date.
For example, if you are running a marketing campaign from 2013-08-01 to 2013-10-01, you want to display:
- 2013-08-01 to be "Day 01"
- 2012-08-02 to be "Day 02"
- 2013-10-01 to be "Day 62" and so on.
This use case is going to show you how you could make it if you only have the date in your data set.
Create a new attribute called campaign_day in the data set and apply transformation script as seen below:
int days= daysBetween(rowDate(), date('2013-08-01')) + 1;

String campaign_days = days.toString();

if(length(campaign_days) == 1) {
  return '0' + campaign_days;
}else {
  return campaign_days;
}
This will return the number of days in terms of the campaign starting time in the format of 00 to 62.
At the report level, set the campaign_day as the drill down and calculate the indicator as seen below:
dateInterval('2013-08-01', '2013-08-01' + ' + ' + memberValue() + 'd') {
  crossValue('ALL_SMS_2_JOINED.ALL_SMS_2_JOINED', 'L_MSISDN_DCOUNT')
}
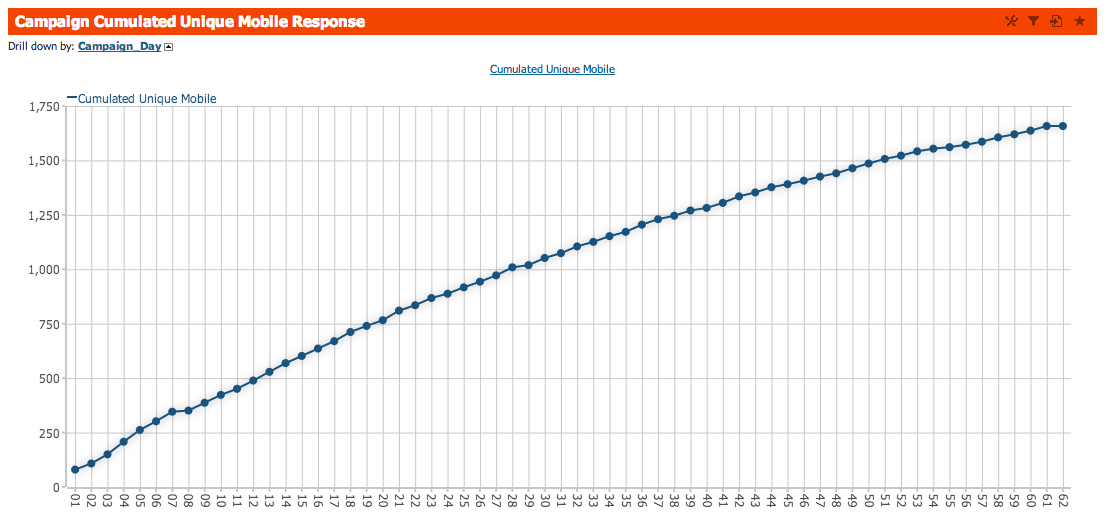
Here is how it looks like in the chart:
Next Steps