Page History
| Sv translation | ||||||
|---|---|---|---|---|---|---|
| ||||||
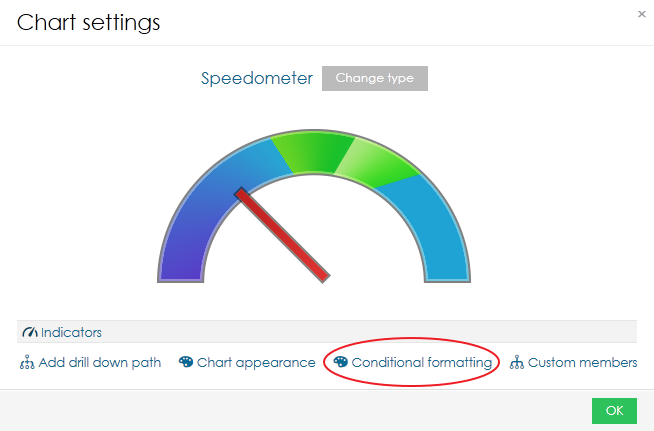
View conditional formattingThis form of conditional formatting is available for charts and maps only and it has a little different function in each case. Chart conditional formattingThis type of conditional formatting is used for highlighting values on axis or scale, for example if you want to highlight some critical value. It is accessible from chart settings.
It is available for these charts:
Step-by-step tutorial
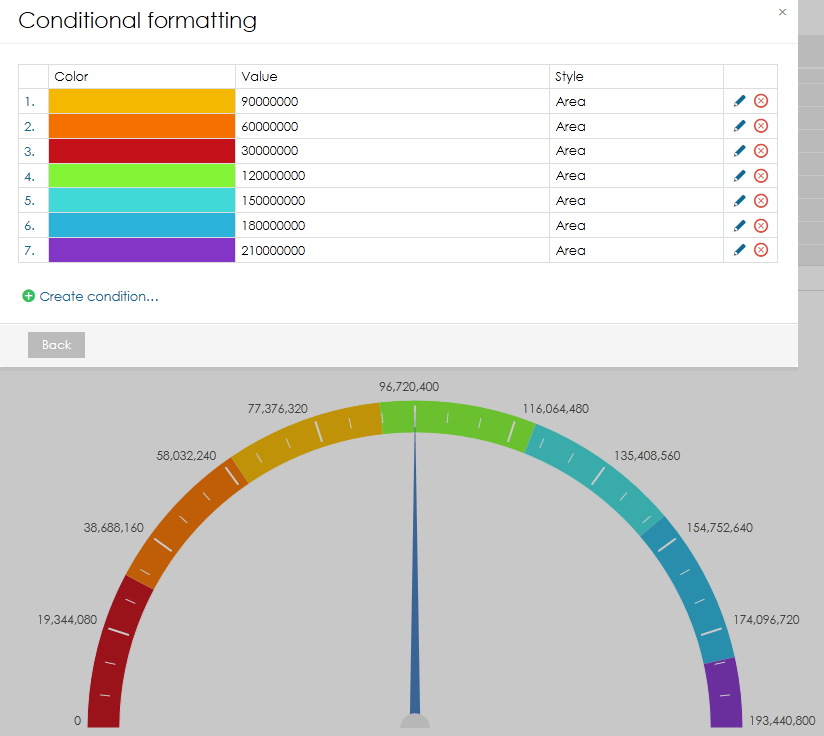
It is possible to add multiple conditions. This way you can create beatiful scales.
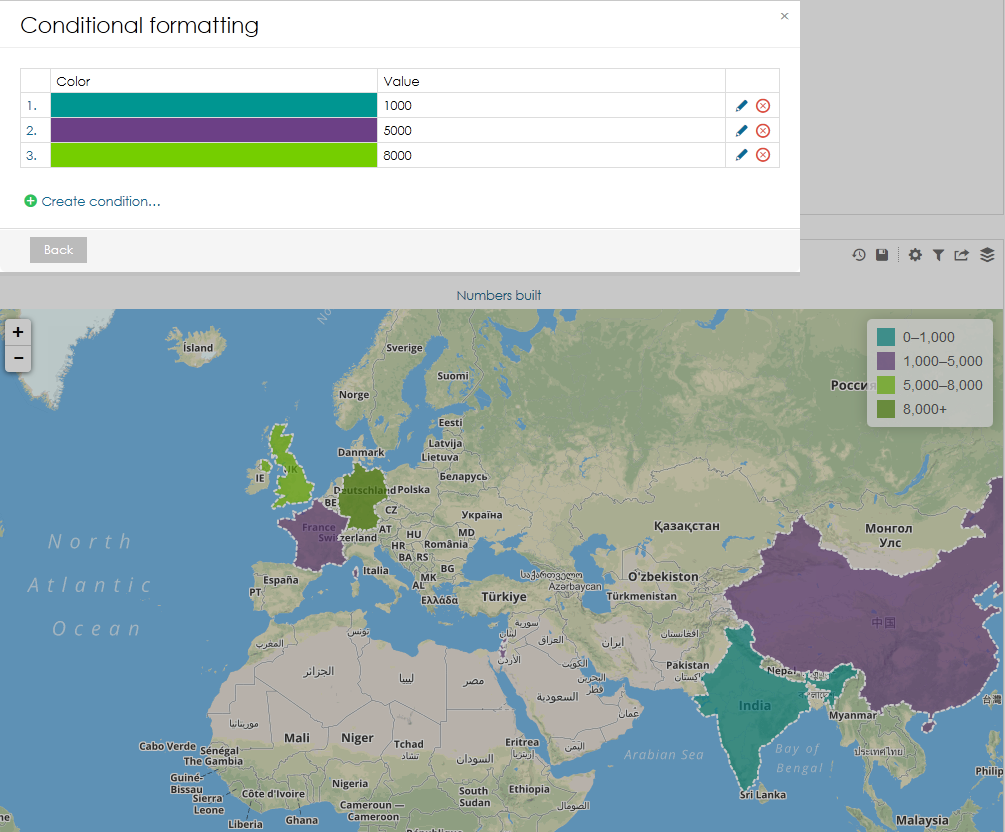
Map conditional formattingConditional formatting in map is primarly used for creating custom color scale. The procedure is the same as in charts.
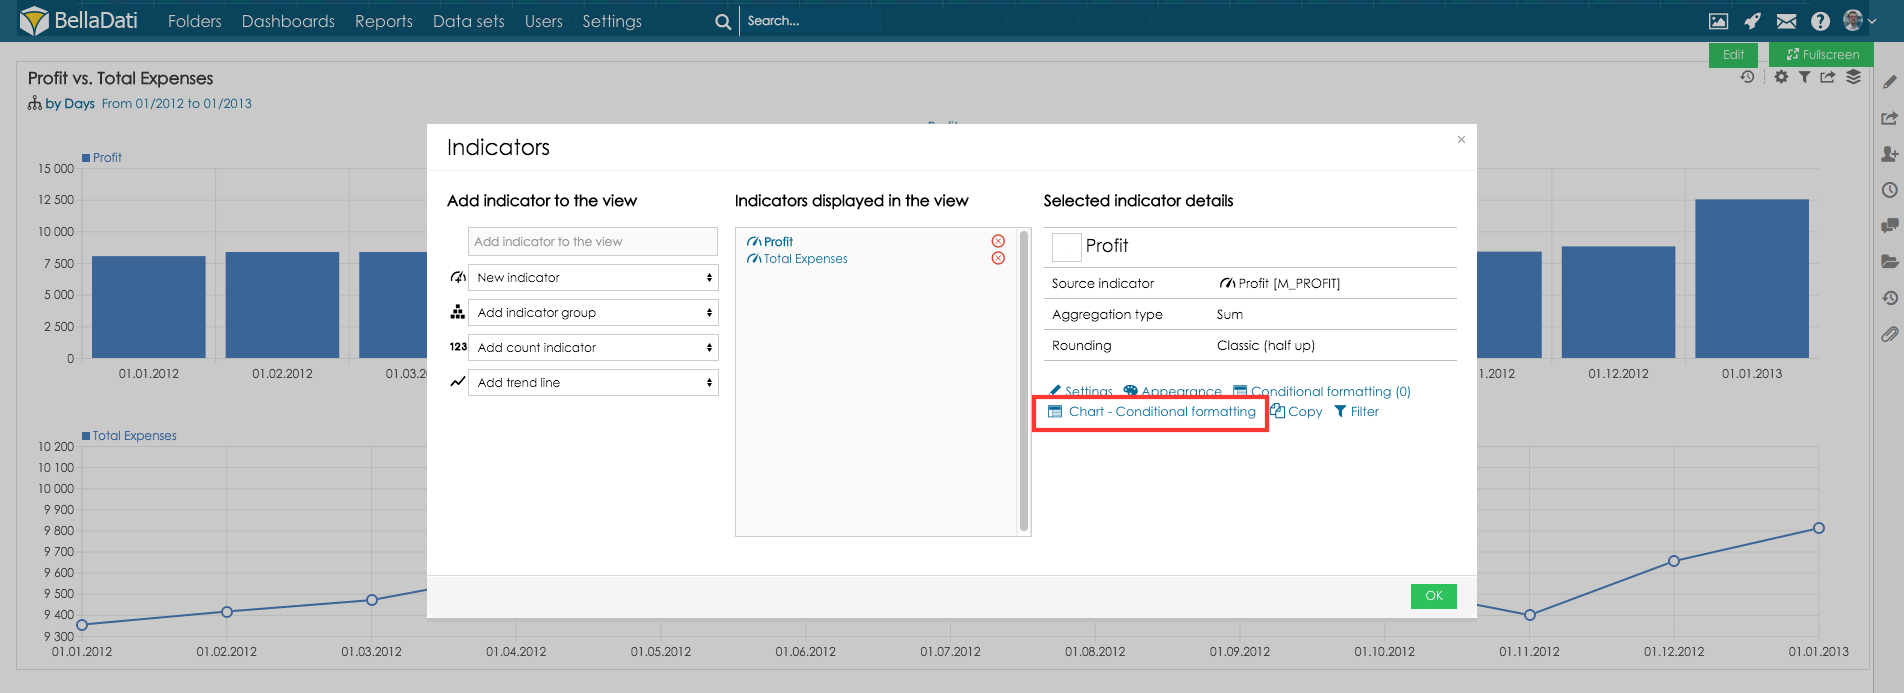
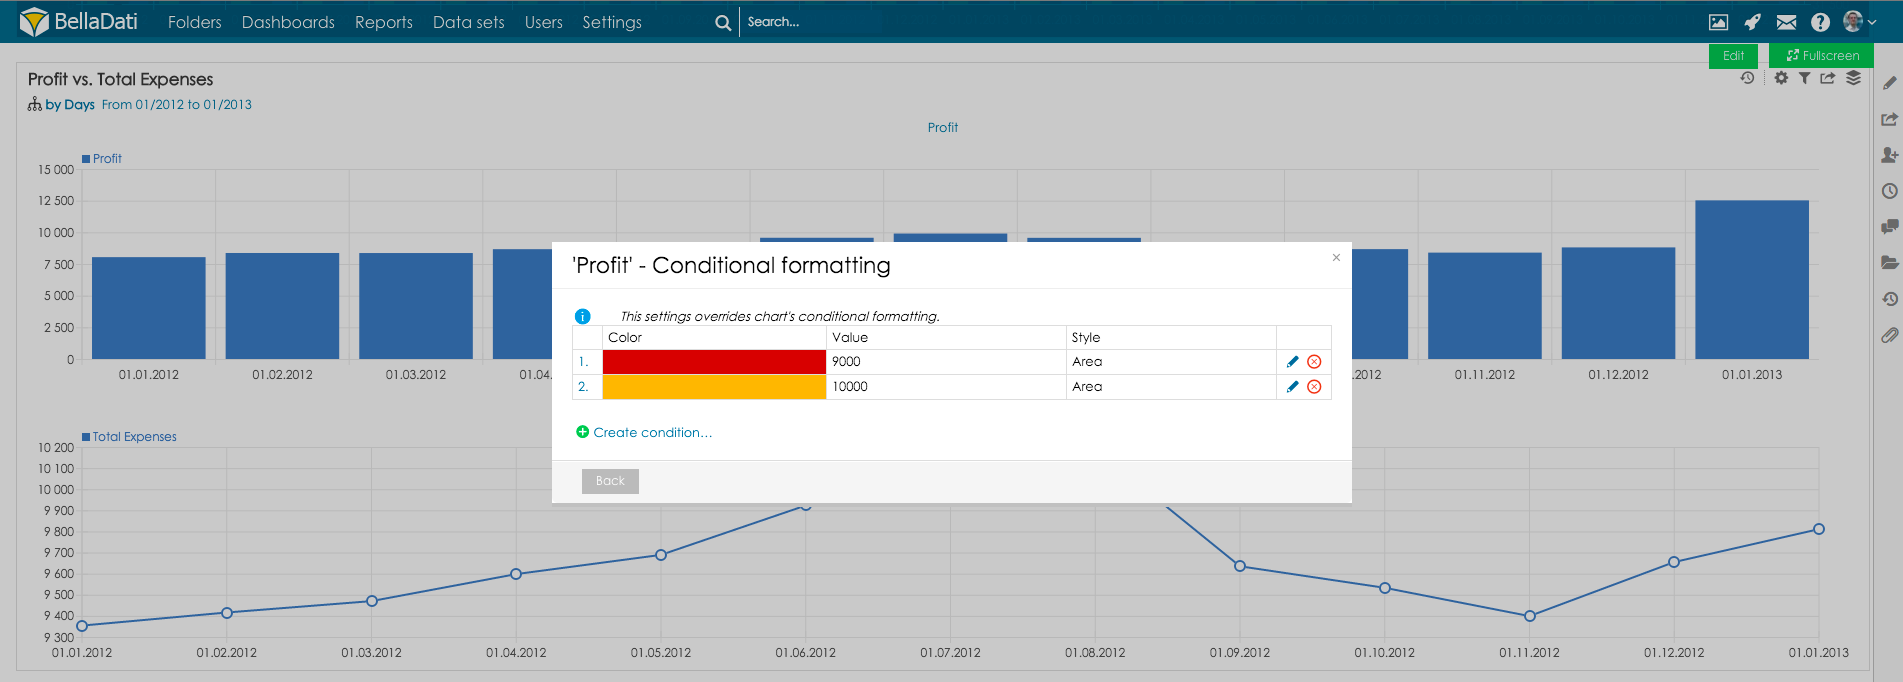
View with multiple indicators conditional formattingIn some cases, you might like to define different conditional formatting for the views which contain multiple indicators.
This feature is accessible from indicator settings, select indicator and go to Chart - conditional formatting:
Now set conditional formatting in the same way as in chart conditional formatting:
|
| Sv translation | |||||||||||
|---|---|---|---|---|---|---|---|---|---|---|---|
| |||||||||||
BellaDatiでellaDatiでは、2種類の条件付き書式があります。種類の条件付き書式があります:
ビューの条件付き書式この条件付き書式形式はチャートやマップのみに利用可能で、それぞれのケースでは少しずつ異なった機能を持っています。この形式の条件付き書式は、チャートとマップでのみ使用でき、それぞれの場合で少し異なる機能があります。 チャートの条件付き書式この種類の条件付き書式は、例えば重要な値のハイライトなど、軸やスケールの値のハイライトに使われます。チャート設定から利用可能です。このタイプの条件付き書式は、例えば重要な値を強調表示する場合など、軸またはスケールの値を強調表示するために使用されます。チャート設定からアクセスできます。
これらのチャートで利用可能です:
段階的なチュートリアル
複数の条件を追加することができます。この方法で、美しいスケールを作成できます。複数の条件を追加することも可能です。このようにして美しいスケールを作成できます。
マップの条件付き書式マップの条件付き書式は主にカスタムの色スケールの作成に使われています。過程はチャートと同様です。マップの条件付き書式は、主にカスタムカラースケールの作成に使用されます。手順は、チャートと同じです。
複数のインジケータで表示する条件付き書式複数のインジケータを持つビューの場合異なる条件付き書式を定義したい場合があるかもしれません。場合によっては、複数のインジケータを含むビューに異なる条件付き書式を定義することができます。
この機能は、インジケータ設定からアクセスでき、インジケータを選択して、チャート - 条件付き書式設定に進みます:この機能はインジケータ設定から利用可能です。インジケータを選択し、チャート – 条件付き書式に進んでください
次に、チャートの条件付き書式と同じ方法で条件付き書式を設定します:
この機能は円チャート、水平積み上げ横棒チャート、放射チャート、ヒートマップ、フィルターチャートでは利用できません。
|
| Sv translation | |||||||||
|---|---|---|---|---|---|---|---|---|---|
| |||||||||
In BellaDati gibt es zwei Arten der bedingten Formatierung:
Bedingte Formatierung anzeigenDiese Form der bedingten Formatierung ist nur für Diagramme und Karten verfügbar und hat jeweils eine etwas andere Funktion. Diagramm bedingte FormatierungDiese Art der bedingten Formatierung wird zum Hervorheben von Werten auf der Achse oder Skala verwendet, z. B. wenn Sie einen kritischen Wert hervorheben möchten. Es ist über die Karteneinstellungen zugänglich.
Es ist für diese Diagramme verfügbar:
Schritt für Schritt Anleitung
Es können mehrere Bedingungen hinzugefügt werden. Auf diese Weise können Sie übersichtliche Skalen erstellen.
Kartenbedingte FormatierungDie bedingte Formatierung in Map wird hauptsächlich zum Erstellen von benutzerdefinierten Farbskalen verwendet. Das Verfahren ist das gleiche wie in Diagrammen.
Anzeigen mit bedingter Formatierung mehrerer IndikatorenIn einigen Fällen möchten Sie möglicherweise eine unterschiedliche bedingte Formatierung für die Ansichten definieren, die mehrere Indikatoren enthalten.
Diese Funktion kann über die Indikatoreneinstellung. Wählen Sie das Kennzeichen aus und gehen Sie zu Diagrammbedingte Formatierung:
Legen Sie die bedingte Formatierung jetzt wie bei der bedingten Formatierung von Diagrammen fest:
|
Overview
Content Tools