Page History
...
| Sv translation | ||
|---|---|---|
| ||
Ein Histogramm ist eine grafische Darstellung der Verteilung numerischer Daten. Es handelt sich um eine spezielle Art von Balkendiagramm. Das Histogramm wird durch Unterteilung der Werte in eine ausgewählte Anzahl von Lagerplätzen erstellt. Die Lagerplätze werden in der Regel als aufeinanderfolgende, nicht überlappende Intervalle einer Variablen angegeben.
|
| Sv translation | ||
|---|---|---|
| ||
ヒストグラムは、数値データの分布をグラフィカルに表現したものです。これは特別な種類の棒グラフです。ヒストグラムは、値を選択した数のビンに分割することで構成されます。ビンは通常、変数の連続した重複しない間隔として指定されます。
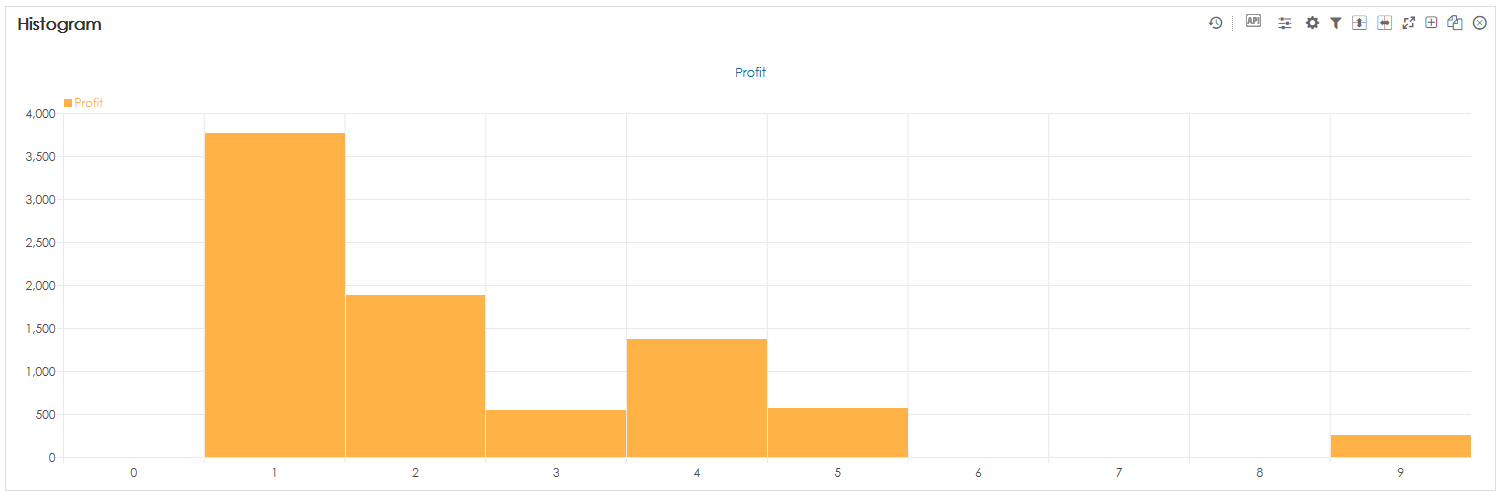
A histogram is a graphical representation of the distribution of numerical data. It is a special kind of bar graph. Histogram is constructed by dividing the values into selected number of bins. The bins are usually specified as consecutive, non-overlapping intervals of a variable.
|
Overview
Content Tools