| Note |
|---|
This option is related to views. Always refer to views or particulat view types ( table , chart , Geo map or KPI label ) before proceeding with this section. |
Indicators represent values displayed in the created view. You can add indicators into view from Indicators dialog box. Indicators dialog box is separated into three columns: - List of Available indicators
- List of Indicators displayed in the view
- Additional Indicator details
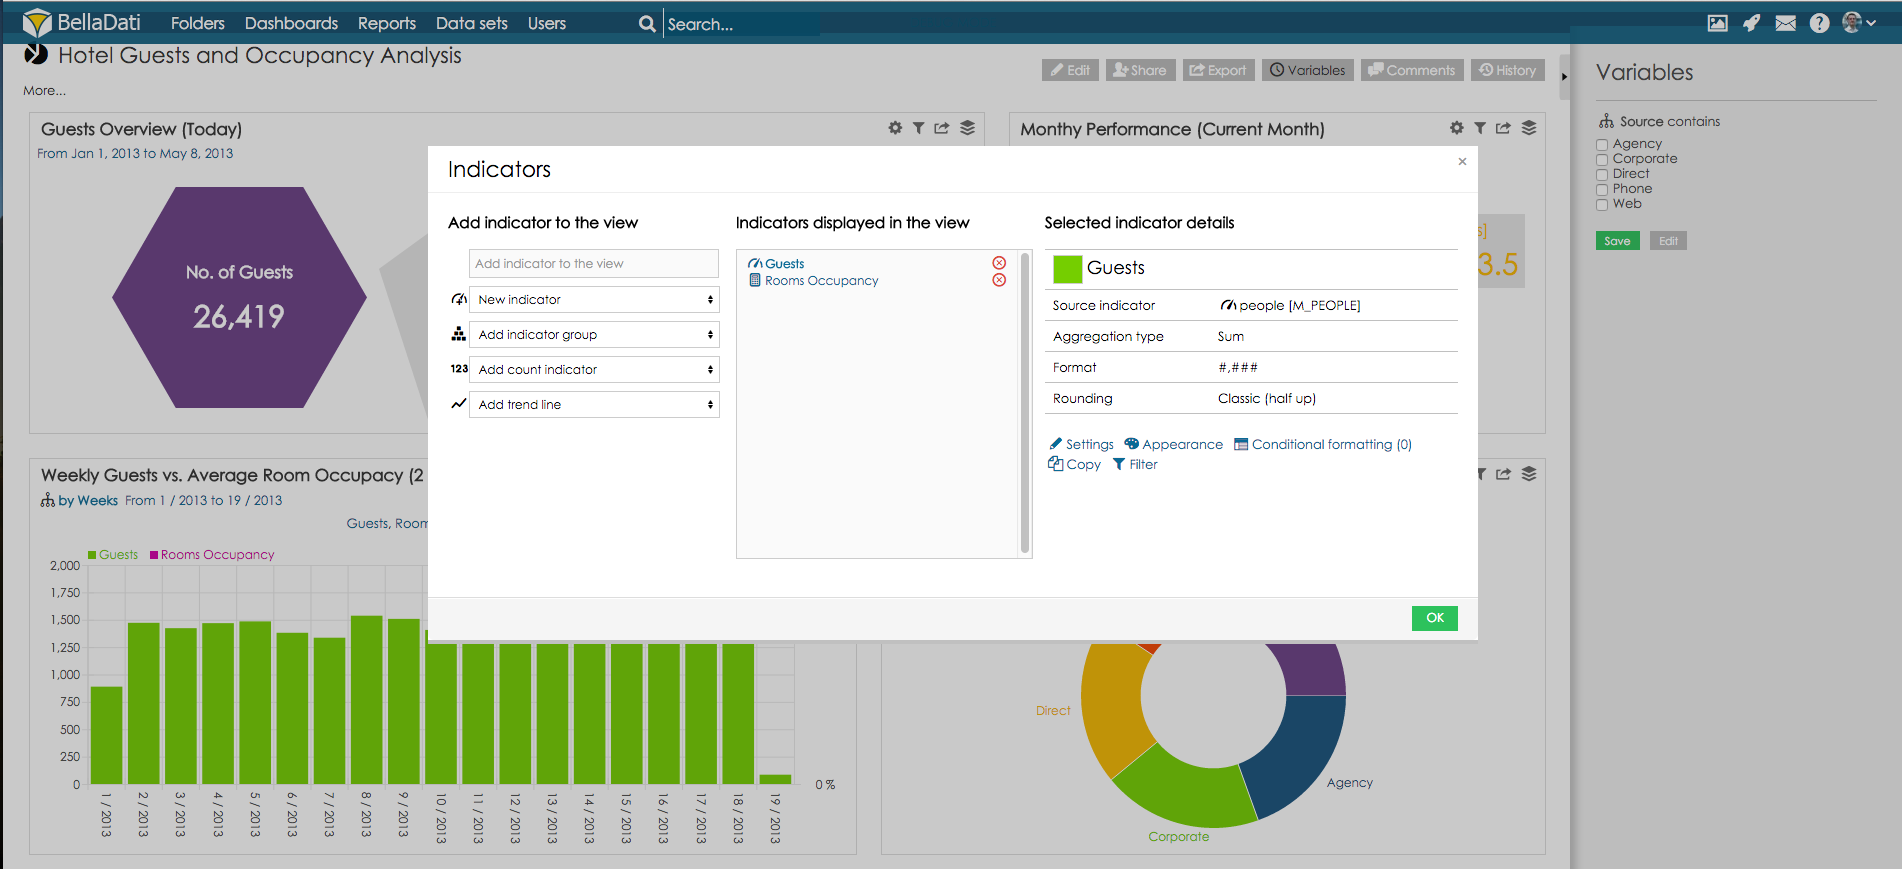
Adding indicatorsThere are two options for adding indicators to the view: - Add from existing: Click on the desired indicator from the list of Available indicators. Indicator will be moved to the Displayed indicators section.
- Create new: Type the name of new indicator into New indicator input form of Displayed indicators section and click green plus sign. To learn more about creating new Indicators, please follow with Using Formulas and scripts .
| Info |
|---|
You can remove displayed indicators by clicking on the red cross sign. |
Indicator detailsIndicator details are accessible in the right column after selecting displayed indicator from Displayed indicators section. Indicator details include: - Name
- Source indicator name
- Color
- Unit
- Format
- Rounding
- Members aggregation
You can perform following tasks to edit displayed indicator: - Edit Indicator setting
- Edit Appearance settings
- Create Conditional formatting
- Duplicate indicator
Edit indicator settingClick Indicator setting to enter edit dialog. From the Indicator setting dialog you can edit: - Name of the indicator.
- Unit to be displayed with the indicator.
- Format of the indicator data. Click show help to expand format syntax hints.
- Rounding of decimal values.
- Select Classic (half-up) option to apply traditional rounding function.
- Select Always up to automatically round data to the higher values.
- Select Always down to automatically round data to the lower values.
- Members aggregation to define how aggregated values should be processed. Click show help to expand members aggregation hints.
- Select Sum to display total value of indicator records.
- Select Average to display average value of indicator records.
- Select Number of records to display count of indicator records.
- Select Minimum to display minimal value from indicator records.
- Select Maximum to display maximal value from indicator records.
- Empty values processing. Select checkbox to edit custom value for emtpy values replacement.
- Show as URL link. Define URL link to create drill-through.
- Column width - for tables only. Allows to set column width for indicators located on horizontal header.
- Numeric transformation. Choose value from combobox to select how the value should be transformed (show percent, thousandth, ten thousandth, millionth, ten millionth, hundred millionth or billionth).
Edit appereance settingsClick Appereance settings to enter edit dialog. From the Appereance settings dialog you can edit: - Font color. Click basic color icon to expand the pallet of predefined font and background colors.
- Font style. Select Bold checkbox to make the indicator values appear in bold.
| Info |
|---|
Select Default from basic color pallet to reset the font color. |
You can also edit indicator color directly from indicator detail. Click on the box next to the indicator name and choose color.
| Anchor |
|---|
| conditional-formatting |
|---|
| conditional-formatting |
|---|
|
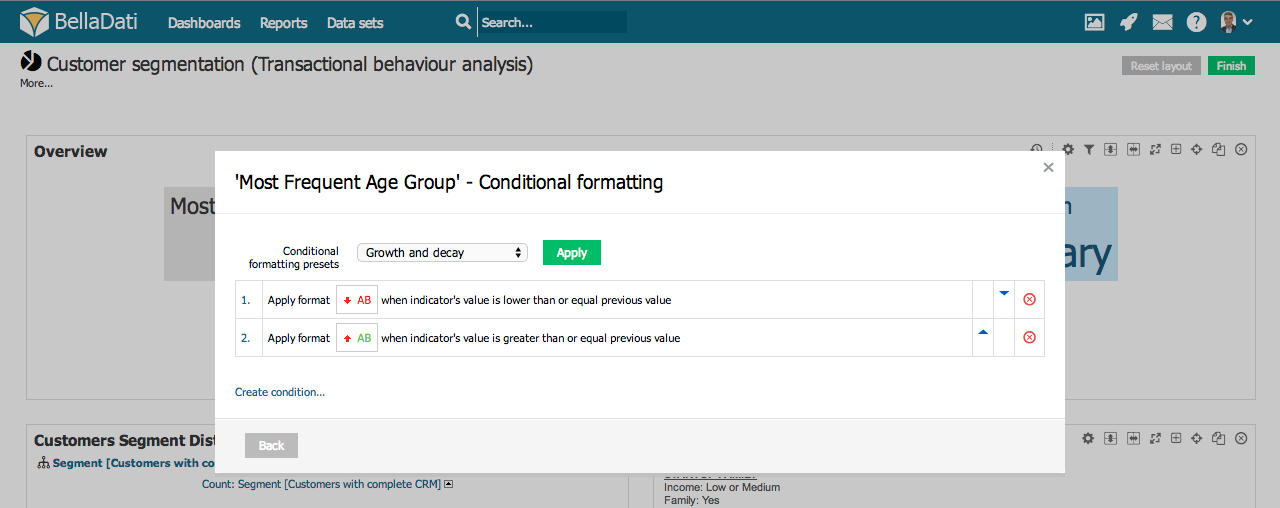
Click Conditional formatting to enter edit dialog. There are two options for creating conditional formatting. Apply preset conditional formatting styles. - Select Black and red numbers to apply discrete formatting based on provided Treshold values.
- Select Growth and decay to apply continuous formatting based on indicator values.
- Select No conditional formatting to reset any defined styles.
Create own conditions and define styles. Click Create condition link to expand condition options. - Select font color and background to be applied to conforming indicator values from predefined palett.
- Select symbol to be appended to conforming indicator values.
- Add custom CSS class. This can be used to add more complex visual customization.
- Select condition to evaluate indicator values. BellaDati offers following conditions:
- greater than
- lower than
- greater by
- lower by
- greater by (%)
- lower by (%)
- between (only for static numerical values, closed interval)
- not between (only for static numerical values, open interval)
- Insert value related to condition or select previous value as source for evaluating the condition.
- Select Show growth/decrease in % checkbox to enrich indicator values with relative changes.
- Condition can be also defined by formula. Click on dropdown indicator and choose value formula. Conditional formatting will be applied when this formula returns true.
Click Add button to confirm create conditional formatting. You can add multiple conditions by repeating the procedure.
| Info |
|---|
You can remove conditional formatting by clicking on the red cross sign. |
If a table is using nested subsets and one the child matches the condition, the parent member is highlighted as well (a triangle icon with exclamation mark). 
| Note |
|---|
Available since BellaDati 2.9.19 |
If a Bar Chart has no defined drill-down, indicator names will be displayed as a labellabels
Next Steps | Related content |
|---|
| | Content by Label |
|---|
| showLabels | false |
|---|
| max | 6 |
|---|
| showSpace | false |
|---|
| cql | label = "indicator" and space = currentSpace() |
|---|
|
|
|