Versions Compared

Key

  • This line was added.
  • This line was removed.
  • Formatting was changed.

...

Sv translation
languageja

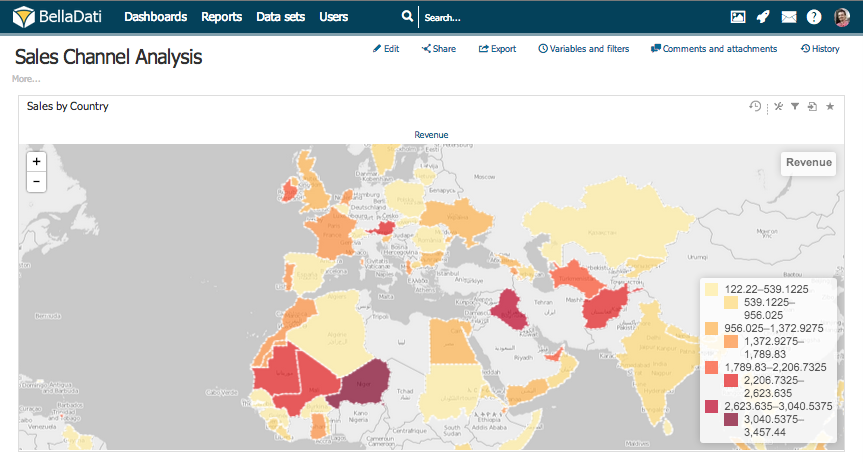
ジオマップでは双方向のマップでインディケーターのビジュアル化ができます

Note

新規のジオマップを作成するには、編集モードにいなくてはいけません。上部のレポートメニューの編集をクリックし、 編集モードを有効化します。

Info

マップチャートジオデータは新規マップの作成前に定義されなければいけません。もしくは、データセットはジオポイントアトリビュトジオJSONアトリビュトを含まなければいけません。

新規ジオマップの追加には、新規行の挿入にマウスをかざし、マップビュータイプをクリックします。すると、新規マップダイアログが表示されます。

  1. 新規マップの名前を入力し、マップに表示するインディケーターを選択してください。
  2. ドリルダウンを追加し、ビューの設定を完了させます。ドリルダウンはマップにデータを分類・置くアトリビュトを定義します (例えば、特定の州の売上インディケーター)
  3. 詳細の表示を選択すると、アトリビュトに従って選択したインディケーターのドリルダウンが行われます (例えば、特定の州と特定のコーヒー製品の売上インディケーター)
  4. 「値の表示」を有効化し、マップにインディケーター値を表示します。
Tip

例: 最も一般的なドリルダウンは、国・リージョン・市を含むジオマップと関連しています。国アトリビュトが選択されたとき:

  • インディケーターは特定の国に従ってグループ化されます
  • 値は国の位置に一致して適切な位置に置かれます

ドリルダウン

チャート設定からドリルダウンを特定できます。ダイアログへのアクセスには:

  1. 作成したビューの「ドリルダウンを追加しビュー設定を完了させる」リンクをクリックします
  2. ツールボックスのマップチャート設定ダイアログに入力し、ドリルダウンパスの追加をクリックします

カスタムのドリルダウン

Anchor
custom-drill-down
custom-drill-down

チャートと表では、他のドリルダウンを設定しマップの細分性を変更できます。そのためにはデータセットアトリビュト設定の既定のジオロケーションマッパーを特定しなければいけません。

全て設定したら、ドリルダウンメンバーをクリックし、カスタムのドリルダウンアトリビュトを選択してドリルダウンの設定をクリックしてください。

既定義のドリルダウンが設定されている場合(例えば国>)、左クリックでドリルダウンすることもできます。既定のポップアップウィンドウは右クリックで利用可能になります。

ここでカスタムドリルダウンの設定に関するビデオをダウンロードできます。

マップ設定 

マップ設定ダイアログでできることは:

  • インディケーター値の集合・分類に使用するアトリビュトまたはジオポイントを特定

  • チェックしたインディケーターの詳細を表示

  • 適切な配置とデータのビジュアル化のための場所定義を選択

  • 場所定義の管理 ジオデータの管理に進む。

  • 希望のマップ提供者の選択

  • ドリルダウンパスのメンバーの制限を設定。現在の整列設定によってメンバーを表示。

アトリビュトを場所定義と関連付ける

ドリルダウン場所定義にはとても弱い関係があります。ドリルダウンがインディケーター値とその分類を維持する間、場所定義は位置特定とその座標を維持します。BellaDatiは自動でアトリビュトメンバーを場所と結びつけ、それゆえ適切な配置を実行できます。

Note

必ず既存の場所定義と関連付けることができる1つのアトリビュトのみ選択してください。関連するジオデータのないアトリビュトの場合、インディケーターは正しく表示されません。


ドリルダウンオプションでは以下を定義できます:

  1. 表示されたインディケーターがグループ化・分類される方法

  2. ビジュアル化されたデータが持つ細分性

  3. 使用されるマッピング背景(標準、白黒、グレースケール、アウトドア、Cycloなど)


場所定義オプションは選択したアトリビュトをジオデータと関連付けるために用いられます。

場所定義を以下に従って選択します:

  1. 選択したドリルダウンパス
  2. 適用したいビジュアル化のスタイル(ポイントvsリージョン)

それぞれの場所定義は場所特定とその座標の組み合わせを含みます。

座標は以下のように表すことができます:

  • ポイント。ポイント定義では、位置は、正確な経度と緯度を表す値の組み合わせによって特定されます。
  • リージョン。リージョン定義では、領域は経度と緯度値から構成される多角形で制限されます。

場所定義に関する詳細はジオデータの管理をご覧下さい。

ジオポイントの使用


ジオポイントは特定の一の緯度と経度座標を持つ特別なアトリビュトタイプです。ジオポイントは、位置情報が直接取り込まれたデータセットに保管されている場合に非常に便利です。ジオポイントは自動で自身の場所定義を生成し、レポートにも直接使えます。

ジオポイントを使うには:

  1. ドリルダウン設定でジオポイントアトリビュトを選択

  2. 関連するポイント定義を見つける

  3. 希望のマップ提供者を選択

マップの管理

挿入したマップビューの右上から追加の操作を実行できます:

  • 設定テーブル
  • フィルター設定 – フィルターの使用に進む
  • ビューの出力 – ビューの出力に進む
  • ダッシュボードへの追加
  • マップの移動

  • マップの複製

  • マップの削除


マップの設定

ツールボックスアイコンをクリックし、マップ設定ダイアログに入力します。

マップ設定ダイアログは現在マップに適用されているインディケータードリルダウンパスを表示します。BellaDatiでできることは:

  • インディケーターまたはドリルダウンパスダイアログの入力

  • ドリルダウンパスの除去

  • 時間軸の追加日付インターバルの設定に進む

  • 条件的フォーマッティングの追加次の段落を参照


条件的フォーマッティング

マップには2通りの条件的フォーマッティングが利用可能です。

  • インディケーターの条件的フォーマッティングインディケーターの表示
  • 背景色は図形に適用され、前景色はポイントに適用される
  • マップの条件的フォーマッティング選択色は、特定の値以下の値のドリルダウンメンバーに適用されます。複数のルールを用いてユーザー自身が色設定を行うこともできます。

画像をインディケーター詳細で表示

マップに使われているアトリビュトメンバーに追加画像がある場合、この画像はインディケーター詳細にも表示されます。

Info

画像はアトリビュトメンバー外観で管理できます。


チュートリアルビデオ

Widget Connector
width853
urlhttps://www.youtube.com/watch?v=krQU1dkiU_0&index=30&list=PL48CzuF9XMMcOBpaXoTyH1a19QF2eU94G
height480


インディケーターの条件的フォーマッティングインディケーターの表示

Sv translation
languagede

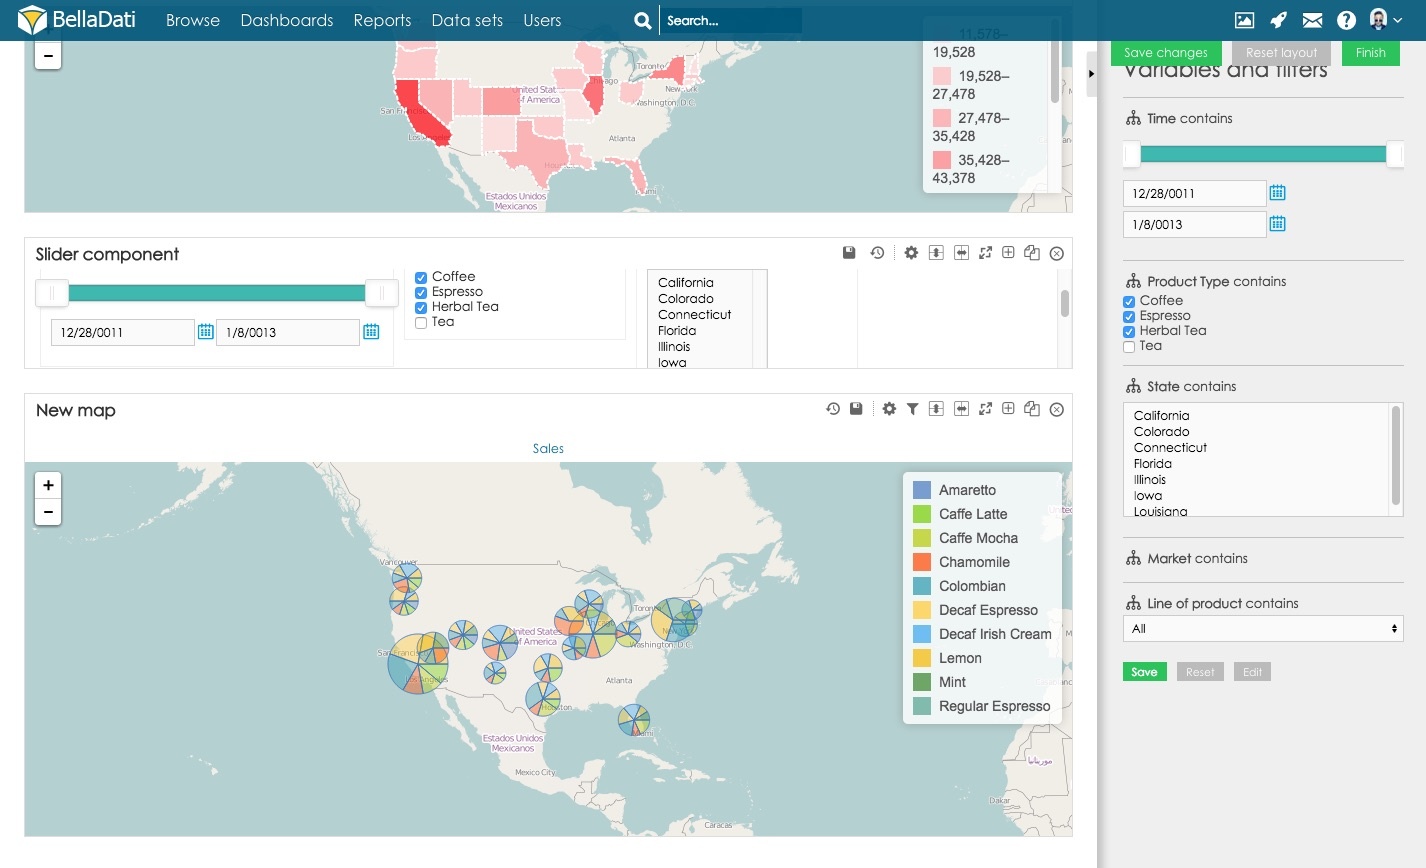
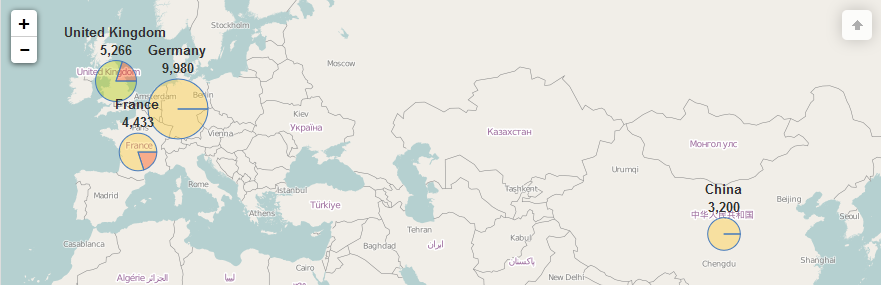
Creating Geo Maps [Original Seitentitel]

Geo maps allow you to visualize Indicators on the interactive maps.

Note

You need to be in edit mode in order to create new Geo map. Click on "Edit" in top report menu to activate edit mode.

Info

Map Charts Geo Data needs to be defined prior to creating new Maps. Or the Data Set has to include GEO Point attribute or GeoJSON attribute.

To add a new Geo map, hover over Insert new row and click on Map view type. New Map dialog will appear.

Image Added

  1. Enter the name of the New map and select Indicators that should be displayed in the map
    Image Added
  2. You have to add Drill down to complete the view setup. Drill down defines which attribute will be used to categorise and position data on the map (for instance Sales indicator for specific State)
    Image Added
  3. You can select Show details for. This option will do drill-down for selected Indicator according the attributes (for instance Sales Indicator for specific State and specific Coffee Product)
    Image Added
  4. You can enable "Show values" to display indicator values on map.
    Image Added
Tip

Example: The most common drill downs associated with Geo maps include Country, Region or City. When Country attribute is selected:

  • Indicators are grouped according particular country.
  • Values are placed to proper position corresponding with country location.

Drill Down

You can specify drill down from Chart settings. To access dialog:
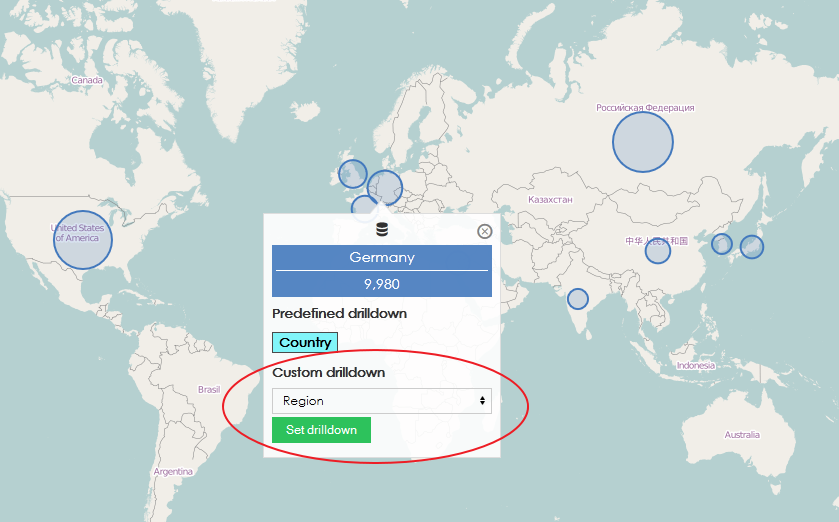
  1. click on add drill down to complete the view setup link in the created view.
  2. enter Map chart settings dialog from the toolbox and click Add drill down path.

Custom drill down

Anchor
custom-drill-down
custom-drill-down

As in chart and tables, you can set another drill down to change the granularity of map. To do so you have to specify default GEO location mapper in Attribute settings in Data Set.

If it is all set, you can click on any drill down member, select Custom drill down Attribute and click on Set drill down.

If Predefined drilldown (for example Country > City) is also set, it is possible to drill-down with left mouse click. Default pop-up window is then available with right click.

Image Added

You can download video of setting custom drill down here

Map settings

Map settings dialog allows you to:

  • Specify Attribute or GEO Point to be used for aggregating and categorizing indicator's values.
  • Show details for monitored Indicator
  • Select Place definition for proper positioning and visualization of data.
  • Manage places definitions - continue by Managing GEO Data .
  • Select desired map provider.
  • Setup Limit for members in the drill down path. Displayed memebers depend on current sorting setup.
  • Specify Number of colors for shape-based map. By default, BellaDati will create scale with eight colors. Users can override this setting.
  • Display Marker instead of points.
  • Link values on the map with a line. Define the weight and color of the line. Or hide points on the line which is used to link the locations.

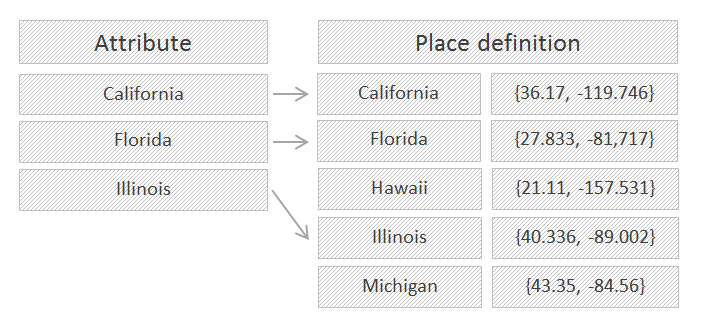
Associating Attribute with Place definition

There is a very thin connection between drill down and place definition. While drill down maintains indicator values and their categorization, place definition keeps pairs of location identification and its coordinates. BellaDati automatically connects attribute's members with places and therefore enables their proper positioning.

Note

You should always select only attributes which can be associated with an existing Place definition. In case of an attribute with no related Geo data, indicators will not be properly displayed.


Image Added


Drill down option allows you to define:

  1. how displayed indicators will be grouped and categorized.
  2. what granularity will visualized data have.
  3. which mapping background will be used (Standard, Black & White, Gray Scale, Outdoors, Cyclo, etc.)


Image Added


Place definition option is used to associate selected attribute with Geo data.

Select Place definition according to:

  1. Drill down path you selected.
  2. Style of visualization you want to apply (point vs. region).

Each Place definition includes pair on place identification and its coordinates.

Coordinates can be represented as:

  • Points. In point definition, location is identified by pair of values representing exact longitude and latitute.
  • Regions. In region definition, area is restricted with polygon, composed of set of longitude and latitude values.

For more information about Place definition continue by Managing GEO Data .

Using GEO Points


GEO point is a special attribute type holding latitude and longitude coordinates of a special location. GEO points are most convenient to use when location information are stored directly in imported Data Set. It automatically generated its own place definition and can be directly used in reports. 

To use geo points:

  1. Select GEO point attribute in Drill-down settings
  2. Find relevant Point definition
  3. Choose desired map provider

Map management

You can perform additional operations in upper right corner of the inserted Map view:

  • Table settings
  • Filter setting - continue by Using Filters
  • Export view - continue by Exporting View
  • Add to dashboard
  • Move map
  • Duplicate map
  • Delete map


Image Added

Map settings

Click on toolbox icon to enter Map settings dialog.

Map settings dialog shows Indicators and Drill down path currently applied to the map. BellaDati allows you to:

  • Enter indicators or drill down path dialogs.
  • Remove drill down path.
  • Add time axis - continue by Setting Date Interval .
  • Add conditional formatting - see next paragraph.


Image Added

Conditional formatting

There are two types of conditional formatting available for maps.

  • Conditional formatting for indicators - Displaying Indicators.
    • Background color is applies for shapes and foreground color for points.
  • Map conditional formatting - chosen color is applied to drill-down member whose value is smaller or equal than specified value. You can create your own color scheme by using multiple rules.

Image Added

Displaying image in indicator details

If there is added image to the attribute member which is used in the map, this image will be also displayed in indicator details.

Image Added

Info

Images can be managed in attribute members appearance.

Linking points on the map

If you want to link the points in the map, select the option link values. In this case, the values are linked based on drill-down used in the map. The drill-down should contain the sequence of the points, e.g. timestamp of the visualized trip.

Image Added

If you want to highlight the points on the map, select one of the markers (option display marker):

Image Added

Video Tutorial

Widget Connector
width853
urlhttps://www.youtube.com/watch?v=krQU1dkiU_0&index=30&list=PL48CzuF9XMMcOBpaXoTyH1a19QF2eU94G
height480

Next Steps

Related content

Wiki Markup
{related:NumLabels=6}