Versions Compared

Key

  • This line was added.
  • This line was removed.
  • Formatting was changed.
Sv translation
languageen

Overview

BellaDati Analytics framework is the framework and out-of-the box platform for IoT and analytics solution providers.It allows you to finish your projects faster while you can focus on solution.
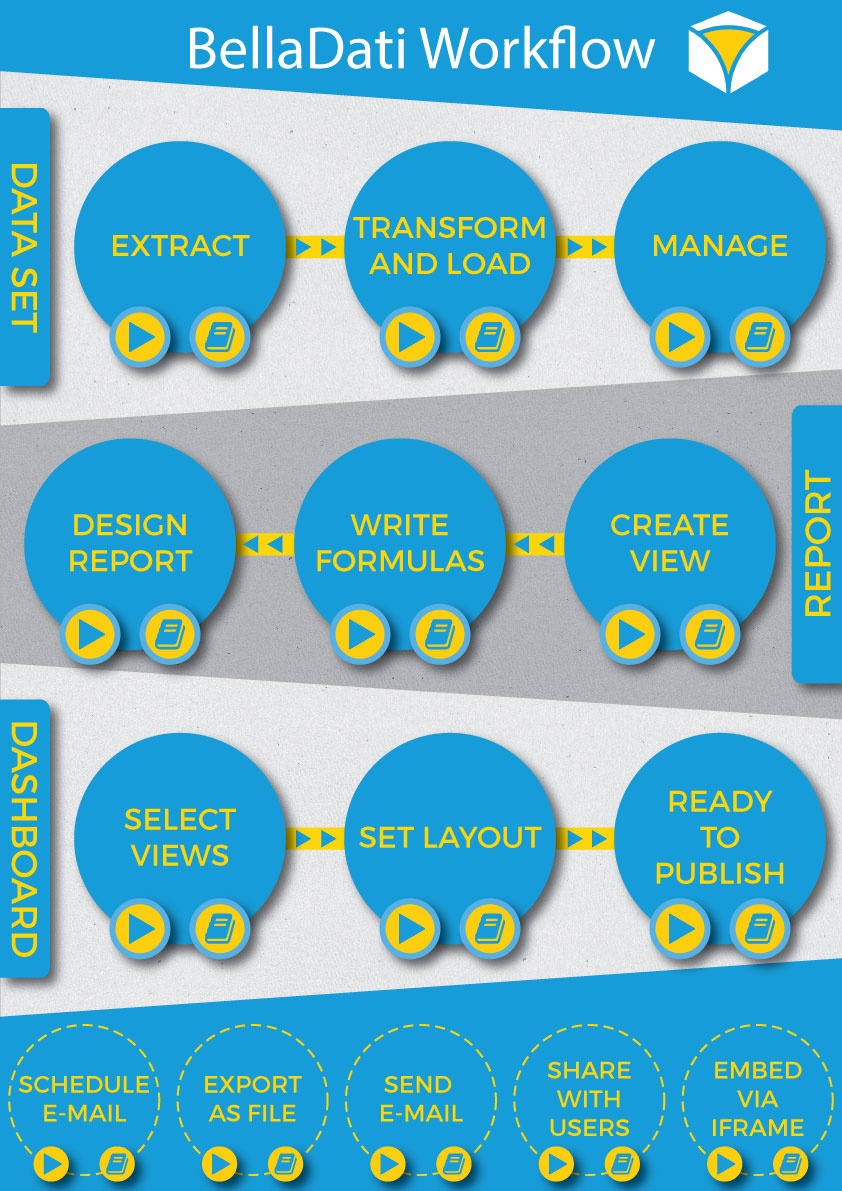
  • data cleaning and ETL
  • BIG DATA data warehouse
  • deep analytics (Machine Learning and Statistics)
  • easy to use AGILE BI
  • SDK, APIs framework (GUI and coding combination)
  • IoT unification platform
  • GEO and other data visualizations


Belladati workflow (ONLY AGILE BI part)

The process of creating reports and dashboard is very simple and can be described with a very straightforward workflow. You can click on the video icon  or documentation icon  to get more information about specific step.

Info
Are you rather looking to use Analytics IoT Framework?


Imagemap
Map<map><area shape="circle" coords="141,338,31" alt="How to import data" href="https://youtu.be/O4KU-bGtrt0" target="_self"/> <area shape="circle" coords="221,337,28" alt="Importing data" href="http://support.belladati.com/doc/Importing+Data" /> <area shape="circle" coords="409,337,31" alt="Working with Data sets and Datasources" href="https://youtu.be/JBhhUg-6eYg" /> <area shape="circle" coords="492,339,30" alt="Import Settings" href="http://support.belladati.com/doc/Import+Settings" /> <area shape="circle" coords="679,336,31" alt="Working with data set" href="https://youtu.be/-CFhx-if1lM" /> <area shape="circle" coords="759,338,30" alt="Managing Indicators" href="http://support.belladati.com/doc/Managing+Indicators" /> <area shape="circle" coords="89,636,30" alt="Using report" href="https://youtu.be/PF7NVfAqcVg?list=PL48CzuF9XMMdAzwmI1V9aEVJJnPEvaZrw" /> <area shape="circle" coords="170,635,29" alt="Report appearance" href="http://support.belladati.com/doc/Report+appearance" /> <area shape="circle" coords="362,635,32" alt="Using report" href="https://www.youtube.com/watch?v=ckfrWGla2DY" /> <area shape="circle" coords="441,635,31" alt="Using formulas" href="http://support.belladati.com/doc/Using+Formulas" /> <area shape="circle" coords="631,637,32" alt="Working with the report" href="https://youtu.be/ckfrWGla2DY" /> <area shape="circle" coords="711,634,31" alt="Creating view" href="http://support.belladati.com/doc/Creating+View" /> <area shape="circle" coords="141,928,31" alt="How to use Dashboard" href="https://youtu.be/WFuK66reRVo" /> <area shape="circle" coords="222,931,31" alt="Creating Dashlet" href="http://support.belladati.com/doc/Creating+Dashlet" /> <area shape="circle" coords="410,930,30" alt="How to use Dashboard" href="https://youtu.be/WFuK66reRVo" /> <area shape="circle" coords="492,930,31" alt="Managing Dashboard Layout" href="http://support.belladati.com/doc/Managing+Dashboard+Layout" /> <area shape="circle" coords="681,929,30" alt="Public dashboard" href="https://youtu.be/fkbqBAONR4M" /> <area shape="circle" coords="761,931,30" alt="Sharing dashboard" href="http://support.belladati.com/doc/Sharing+Dashboard" /> <area shape="circle" coords="52,1165,17" alt="Schedule an e-mail" href="https://www.youtube.com/watch?v=U4PmccBi8j8" /> <area shape="circle" coords="120,1164,18" alt="Schedule an e-mail" href="http://support.belladati.com/doc/Export+schedule" /> <area shape="circle" coords="221,1165,17" alt="Export into external formats" href="https://www.youtube.com/watch?v=ZSbaaZD84p4" /> <area shape="circle" coords="285,1163,17" alt="Exporting Report" href="http://support.belladati.com/doc/Exporting+Report" /> <area shape="circle" coords="389,1165,17" alt="Send as e-mail" href="https://www.youtube.com/watch?v=U4PmccBi8j8" /> <area shape="circle" coords="454,1164,17" alt="Exporting report" href="http://support.belladati.com/doc/Exporting+Report" /> <area shape="circle" coords="558,1165,19" alt="Share with users" href="https://youtu.be/45LmG3pDyA4" /> <area shape="circle" coords="622,1164,18" alt="Sharing report" href="http://support.belladati.com/doc/Sharing+Report" /> <area shape="circle" coords="726,1165,17" alt="Embed using iFrame" href="https://youtu.be/8nOj0i01OIA" /> <area shape="circle" coords="790,1164,19" alt="Exporting View" href="http://support.belladati.com/doc/Exporting+View" /> <area shape="rect" coords="2,110,50,385" alt="Data Sets" href="http://support.belladati.com/doc/Data+Sets" /> <area shape="rect" coords="793,404,839,684" alt="Reports" href="http://support.belladati.com/doc/Reports" /> <area shape="rect" coords="1,700,49,978" alt="Dashboard" href="http://support.belladati.com/doc/Dashboards" /></map>


basic concepts

Key concepts used in BellaDati are described below. See BellaDati glossary for details.

Data set

BellaDati has its own integrated data warehouse. This warehouse contains virtual databases that represents data with similar characteristics. These virtual databases are called data sets and reports are build on them. Each data set can be connected to multiple data sources.

Possible actions: Importing data | Browsing data | Exporting data | Structure backup | Joining data sets | Watching data changes | Cleaning data | Sharing data | Defining attributes | Defining indicators | Creating and removing datasets

Data source

Imagine companies has already running their business. Such company has applications and systems installed or use services that generate a lot of data in underlying databases. Moreover employees produces Excel spreadsheets, text or CSV files of data. These databases and files are very suitable data sources for BellaDati analysis. Generally BellaDati can import data from all third party systems which are called data sources.

Possible actions: Connecting to database | Connecting over HTTP | Connecting to FaceBook | Connecting to Google Services | Connecting to CRM | Scheduling automatic upload

Report

Report is basically a set of tables and charts created mainly for detailed overview and analytical purposes on data stored in data sets. Each report can also contain custom content, comments, attachments and can be easily shared with other BellaDati users or published to corporate intranet or public. Permanent export of each report to PDF, Excel, PNG or Power Point is possible.

Possible actions: Creating report | Managing Layout | Creating view | Creating table | Creating chart | Creating geo map | Creating KPI label | Copying report | Sharing report | Exporting report | Adding comments | Publishing report | Filtering data | Using Formulas and scripts | Searching and Filtering Reports

Dashboard

Dashboard typically consists of the most important tables or charts from reports and is primarily determined for managers who need quick overview of actual company situation. Each dashboard can be customized by adding special content (dashlets). Dashboards can be also shared for public via web.

Possible actions: Creating dashboard | Managing Layout | Creating Dashlet | Sharing Dashboard | Adding Attachment

Additional information

Before you start working with BellaDati, we suggest that you first check these links:

Children Display
depth1


...

Sv translation
languageja

概要

BellaDati分析フレームワークは、IoTおよび分析ソリューションプロバイダのためのフレームワークであり、すぐに使えるプラットフォームです。ソリューションに集中できると同時に、プロジェクトをより早く完成させることが可能です。

  • データクリーニングとETL
  • ビッグデータのデータウェアハウス
  • 深層分析(機械学習と統計)
  • 使いやすいアジャイルBI
  • SDK、APIフレームワーク(GUIおよびコーディングの組み合わせ)
  • IoT統合プラットフォーム
  • Geoおよびその他のデータの視覚化


Belladatiワークフロー (アジャイルBI部分のみ)

レポートとダッシュボードを作成するプロセスは非常にシンプルで、分かりやすいワークフローで表されます。特定の手順に関する詳細情報を得るには、ビデオアイコンかドキュメントアイコンをクリックします。

Info
アナリティクスIoTフレームワークの使用を検討していますか?


Imagemap
Map<map><area shape="circle" coords="141,338,31" alt="How to import data" href="https://youtu.be/O4KU-bGtrt0" target="_self"/> <area shape="circle" coords="221,337,28" alt="Importing data" href="http://support.belladati.com/doc/Importing+Data" /> <area shape="circle" coords="409,337,31" alt="Working with Data sets and Datasources" href="https://youtu.be/JBhhUg-6eYg" /> <area shape="circle" coords="492,339,30" alt="Import Settings" href="http://support.belladati.com/doc/Import+Settings" /> <area shape="circle" coords="679,336,31" alt="Working with data set" href="https://youtu.be/-CFhx-if1lM" /> <area shape="circle" coords="759,338,30" alt="Managing Indicators" href="http://support.belladati.com/doc/Managing+Indicators" /> <area shape="circle" coords="89,636,30" alt="Using report" href="https://youtu.be/PF7NVfAqcVg?list=PL48CzuF9XMMdAzwmI1V9aEVJJnPEvaZrw" /> <area shape="circle" coords="170,635,29" alt="Report appearance" href="http://support.belladati.com/doc/Report+appearance" /> <area shape="circle" coords="362,635,32" alt="Using report" href="https://www.youtube.com/watch?v=ckfrWGla2DY" /> <area shape="circle" coords="441,635,31" alt="Using formulas" href="http://support.belladati.com/doc/Using+Formulas" /> <area shape="circle" coords="631,637,32" alt="Working with the report" href="https://youtu.be/ckfrWGla2DY" /> <area shape="circle" coords="711,634,31" alt="Creating view" href="http://support.belladati.com/doc/Creating+View" /> <area shape="circle" coords="141,928,31" alt="How to use Dashboard" href="https://youtu.be/WFuK66reRVo" /> <area shape="circle" coords="222,931,31" alt="Creating Dashlet" href="http://support.belladati.com/doc/Creating+Dashlet" /> <area shape="circle" coords="410,930,30" alt="How to use Dashboard" href="https://youtu.be/WFuK66reRVo" /> <area shape="circle" coords="492,930,31" alt="Managing Dashboard Layout" href="http://support.belladati.com/doc/Managing+Dashboard+Layout" /> <area shape="circle" coords="681,929,30" alt="Public dashboard" href="https://youtu.be/fkbqBAONR4M" /> <area shape="circle" coords="761,931,30" alt="Sharing dashboard" href="http://support.belladati.com/doc/Sharing+Dashboard" /> <area shape="circle" coords="52,1165,17" alt="Schedule an e-mail" href="https://www.youtube.com/watch?v=U4PmccBi8j8" /> <area shape="circle" coords="120,1164,18" alt="Schedule an e-mail" href="http://support.belladati.com/doc/Export+schedule" /> <area shape="circle" coords="221,1165,17" alt="Export into external formats" href="https://www.youtube.com/watch?v=ZSbaaZD84p4" /> <area shape="circle" coords="285,1163,17" alt="Exporting Report" href="http://support.belladati.com/doc/Exporting+Report" /> <area shape="circle" coords="389,1165,17" alt="Send as e-mail" href="https://www.youtube.com/watch?v=U4PmccBi8j8" /> <area shape="circle" coords="454,1164,17" alt="Exporting report" href="http://support.belladati.com/doc/Exporting+Report" /> <area shape="circle" coords="558,1165,19" alt="Share with users" href="https://youtu.be/45LmG3pDyA4" /> <area shape="circle" coords="622,1164,18" alt="Sharing report" href="http://support.belladati.com/doc/Sharing+Report" /> <area shape="circle" coords="726,1165,17" alt="Embed using iFrame" href="https://youtu.be/8nOj0i01OIA" /> <area shape="circle" coords="790,1164,19" alt="Exporting View" href="http://support.belladati.com/doc/Exporting+View" /> <area shape="rect" coords="2,110,50,385" alt="Data Sets" href="http://support.belladati.com/doc/Data+Sets" /> <area shape="rect" coords="793,404,839,684" alt="Reports" href="http://support.belladati.com/doc/Reports" /> <area shape="rect" coords="1,700,49,978" alt="Dashboard" href="http://support.belladati.com/doc/Dashboards" /></map>

基本の考え

BellaDatiでキーとなる考え方を以下に記述します。BellaDati用語集で詳細をご覧ください。

データセット

BellaDatiは独自の統合データウェアハウスを持ちます。このウェアハウスは仮想データベースを含み、そのデータベースは似た性質のデータを表します。これらの仮想データベースはデータセットと呼ばれ、レポートはそれらに基づいて構築されます。各データセットは複数のデータソースに接続できます。

できること: Importing Data | Browsing Data | Structure Backup | Joining Data Sets | Watching Data Changes | Sharing Data Sets | Managing Attributes | Managing Indicators | Creating Data Set

データソース

既にビジネスを進めている企業を想像してください。そのような企業は、基盤となるデータベースに大量のデータを生成するアプリケーションやシステムがインストールされているか、サービスを使用しています。さらに、従業員はエクセルのスプレッドシートか、テキストもしくはCSVファイルを作成します。これらのデータベースとファイルはBellaDatiでの分析に非常に適したデータソースです。一般的にBellaDatiは、データソースと呼ばれるすべてのサードパーティシステムからデータをインポートすることが可能です。

できること: Connecting to SQL Database | Connecting over HTTP | Connecting to Facebook | Connecting to Google Analytics | Connecting to Salesforce | Scheduling Import

レポート

レポートは基本的には表とチャートの集合で、データセットに格納されているデータの詳細な概要と分析のために作成されます。各レポートにはカスタムコンテンツ、コメント、添付ファイルを含めることもでき、他のBellaDatiユーザーと簡単に共有したり、社内イントラネットや一般の人々に公開することもできます。各レポートをPDF、エクセル、PNG、パワーポイントにエクスポートすることが可能です。

できること: Creating Report | Managing Layout | Creating View | Creating Table | Creating Chart | Creating Geo Maps | Creating KPI labels | Copying Report | Sharing Report | Exporting Report | Adding Comments and Attachments | Publishing to Dashboard | Variables and Filters | Using Formulas and scripts | Searching and Filtering Reports

ダッシュボード

ダッシュボードは通常、レポートから最も重要な表とチャートで構成され、主に会社の実状の概要を迅速に把握する必要がある管理者向けに定義されます。各ダッシュボードは、特別なコンテンツ(ダッシュレット)を追加することによってカスタマイズできます。ダッシュボードはWeb経由で一般に公開することも可能です。

できること: Creating Dashboard | Managing Dashboard Layout | Creating Dashlet | Sharing Dashboard | Adding Attachment

追加情報

BellaDatiを使い始める前に、 これらのリンクをチェックすることをお勧めします:

Children Display
depth1


Sv translation
languagede

Überblick

Das BellaDati Analytics-Framework ist ein Framework und eine sofort einsetzbare Plattform für Anbieter von IoT- und Analyselösungen. Es ermöglicht Ihnen, Ihre Projekte schneller abzuschließen, während Sie sich auf die Lösung konzentrieren können.

  •      Datenreinigung und ETL
  •      Big Data Data Warehouse
  •      Deep Analytics (Maschinelles Lernen und Statistik)
  •      Einfach zu bedienen AGILE BI
  •      SDK, APIs-Framework (GUI und Kodierungskombination)
  •      IoT-Vereinigungsplattform
  •      GEO und andere Datenvisualisierungen


Belladati workflow (Ausschließlich AGILEr BI part)

Das Erstellen von Reports und Dashboards ist sehr einfach und kann mit einem sehr unkomplizierten Arbeitsablauf beschrieben werden. Sie können auf das Videosymbol  oder das Dokumentationssymbol klicken, um weitere Informationen zu den einzelnen Schritten zu erhalten.

Info
Möchten Sie lieber das Analytics IoT Framework verwenden?
HTML
<div style="box-shadow: 4px 2px 6px -1px #555C5D; width:600px;height:848px">
Imagemap
nameAttachmentResourceIdentifier[attachmentContainerResourceIdentifier=<null>,filename=BellaDati-Workflow.jpg]
width600

HTML
</div>

grundlegendes Konzept

Die wichtigsten Konzepte von BellaDati werden im Folgenden beschrieben. Weitere Informationen finden Sie im BellaDati Glossar.


Dataset


BellaDati verfügt über ein eigenes integriertes Data Warehouse. Dieses Warehouse enthält virtuelle Datenbanken, die Daten mit ähnlichen Merkmalen darstellen.
Diese virtuellen Datenbanken werden als Datensätze bezeichnet und darauf aufbauend werden Reports erstellt. Jeder Dataset kann mit mehreren Datenquellen verbunden werden.


Mögliche Maßnahmen: Daten importieren | Daten durchsuchen | Daten exportieren | Struktursicherung | Datensätze zusammenfügen | Datenänderungen beobachten | Reinigungsdaten | Daten freigeben | Attribute definieren | Indikatoren definieren | Datensätze erstellen und entfernen


Possible actions: Daten importieren | Daten durchsuchen | Daten exportieren | Struktursicherung | Datensätze zusammenfügen | Datenänderungen beobachten | Datenbereinigung | Daten freigeben | Attribute definieren | Indikatoren definieren | Datensätze erstellen und entfernen


Datenquelle


Stellen Sie sich vor, dass Unternehmen ihr Geschäft bereits führen. In einem solchen Unternehmen werden Anwendungen und Systeme installiert oder Dienste verwendet, die viele Daten in den zugrunde liegenden Datenbanken generieren. Darüber hinaus produzieren Mitarbeiter Excel-Arbeitsblätter, Text- oder CSV-Dateien. Diese Datenbanken und Dateien sind sehr geeignete Datenquellen für die BellaDati-Analyse. Im Allgemeinen kann BellaDati Daten aus allen Fremdsystemen importieren, die als Datenquellen bezeichnet werden.


Mögliche Aktionen: Verbindung zur Datenbank herstellen | Verbindung zur URL herstellen | Verbindung zu FaceBook herstellen | Verbindung zu Google Service herstellen | Verbindung zum CRM herstellen | Automatisches Hochladen planen

Report

Der Report ist im Wesentlichen ein Satz von Tabellen und Diagrammen, der hauptsächlich für detaillierte Übersichts- und Analysezwecke der in Datensätzen gespeicherten Daten erstellt wurde. Jeder Report kann auch benutzerdefinierten Inhalt, Kommentare und Anhänge enthalten und kann problemlos mit anderen BellaDati-Benutzern geteilt oder im Intranet oder in der Öffentlichkeit veröffentlicht werden. Ein permanenter Export jedes Reportss nach PDF, Excel, PNG oder Power Point ist möglich.


Mögliche Maßnahmen: Report erstellen | Layout verwalten | View ersteKommentare hinzufügennllen | Tabelle erstellen | Diagramm erstellen | Geo-Map erstellen | KPI-Label erstellen | Report kopieren | Report freigeben | Report exportiern | Kommentare hinzufügen | Reports veröffentlichen | Daten filtern | Verwenden von Formeln und Skripten | Reportssuchen und filtern

Dashboard

Das Dashboard besteht typischerweise aus den wichtigsten Tabellen oder Diagrammen aus Reports und ist in erster Linie für Manager gedacht, die einen schnellen Überblick über die aktuelle Unternehmenssituation benötigen. Jedes Dashboard kann durch Hinzufügen von speziellen Inhalten (Dashlets) angepasst werden. Dashboards können auch für die Öffentlichkeit über das Internet freigegeben werden.

Mögliche Aktionen: Dashboard erstellen | Layout verwalten | Dashlet erstellen | Dashboard teilen | Anhang hinzufügen


Zusätzliche Informationen

Bevor Sie mit der Arbeit mit BellaDati beginnen, empfehlen wir Ihnen, diese Links zu überprüfen:

Children Display
depth1