Page History
| Sv translation | |||||||
|---|---|---|---|---|---|---|---|
| |||||||
| Section | column
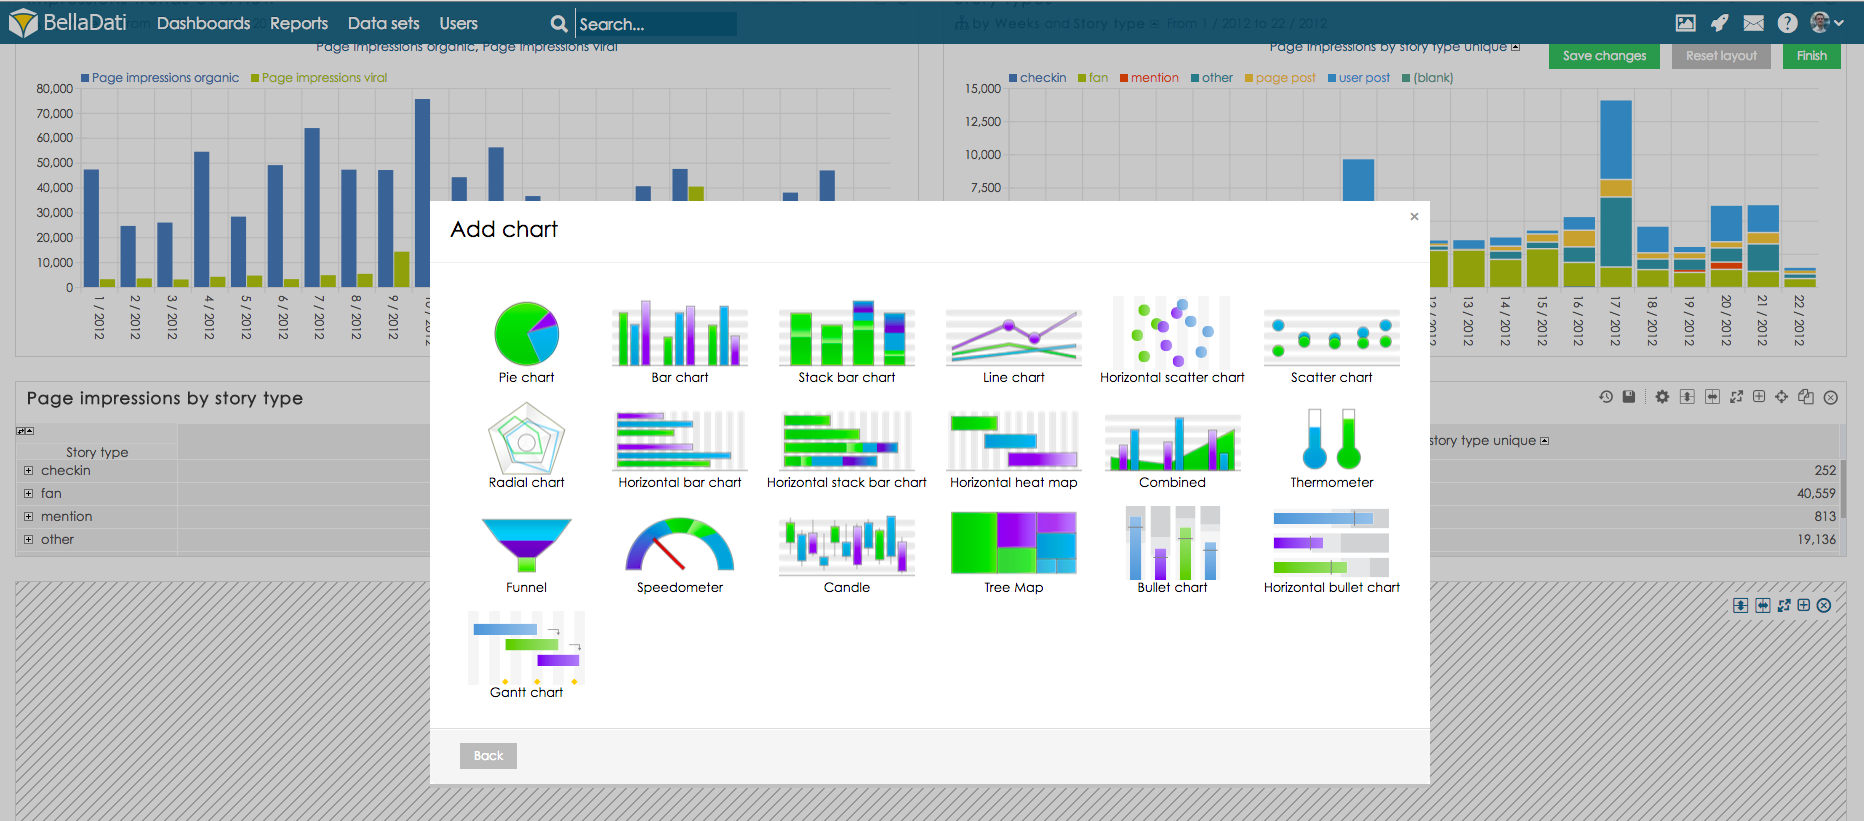
Select desired chart type. BellaDati will guide you through additional setup.
| ||||||
| |||||||
|
|
|
|
|
|

Chart management
You can perform additional operations in the upper right corner of the inserted Chart view:
- Chart settings - see below
- Associate - continue by Associated views
- Drill down paths - continue by Defining Drill-down Path
- Indicators - continue by Displaying Indicators
- Chart appearance - continue by Managing chart appearance
- Filter setting - continue by
- Static Filters
- Export view - continue by Exporting View
- Add to dashboard - continue by Creating Dashlet
- Move chart - use drag&drop for changing the layout of report
- Duplicate chart - click on the Copy icon
- Delete chart - click on the "x" icon
| Tip |
|---|
Hover over Indicators in the toolbox list to quickly add or remove indicators. Hover over Drill down path in the toolbox list to quickly add or remove attributes. |
Chart Settings
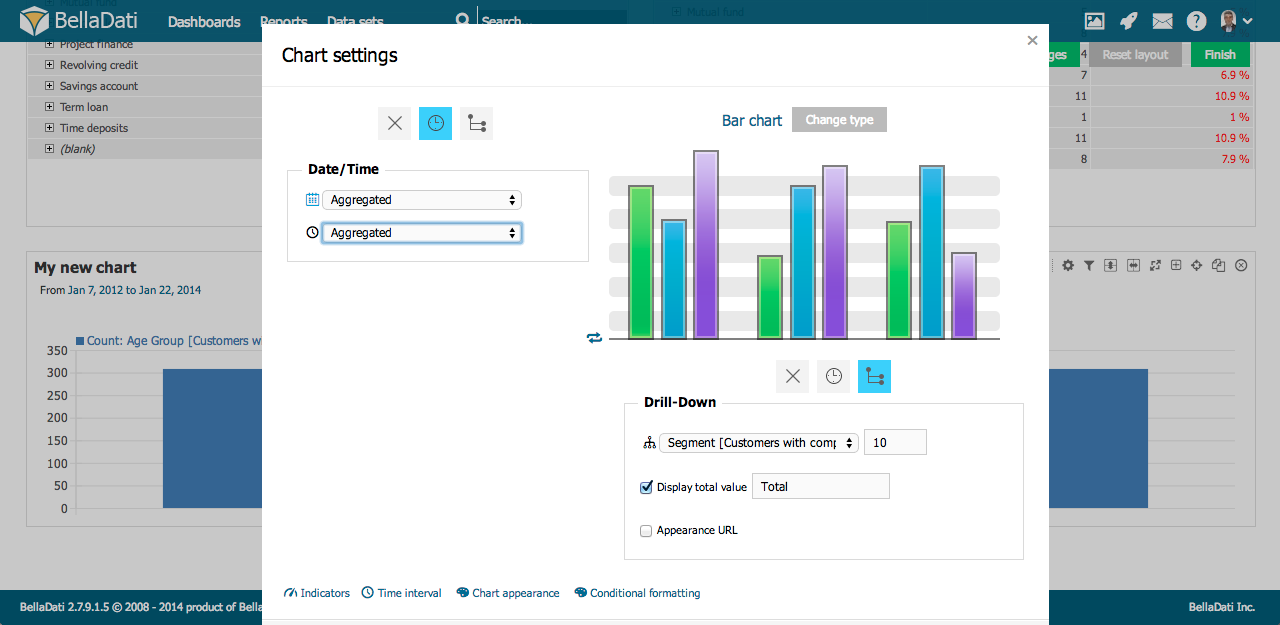
Click on toolbox icon or select Chart settings from the toolbox list to enter Chart settings dialog.
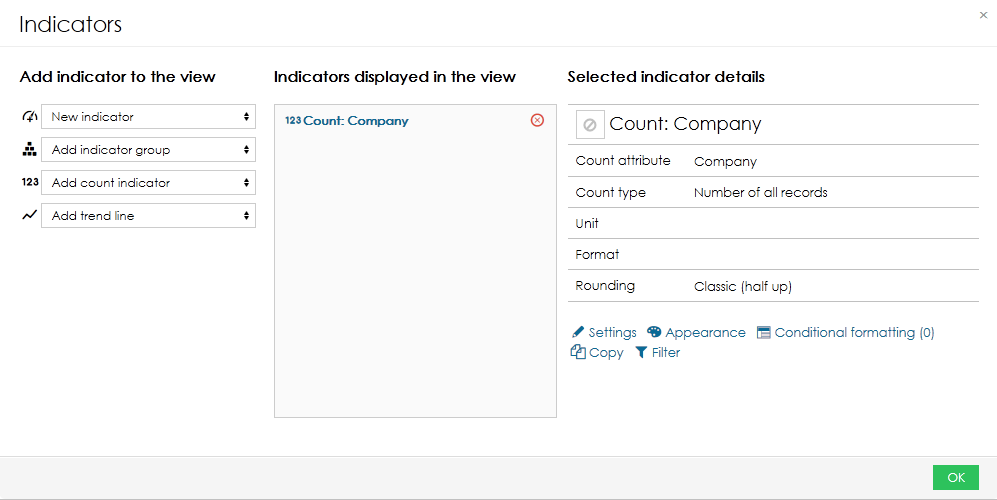
Each chart usually contains at least one indicator. Chart settings dialog allows you to:
- Edit Indicators
- Change type of the chart
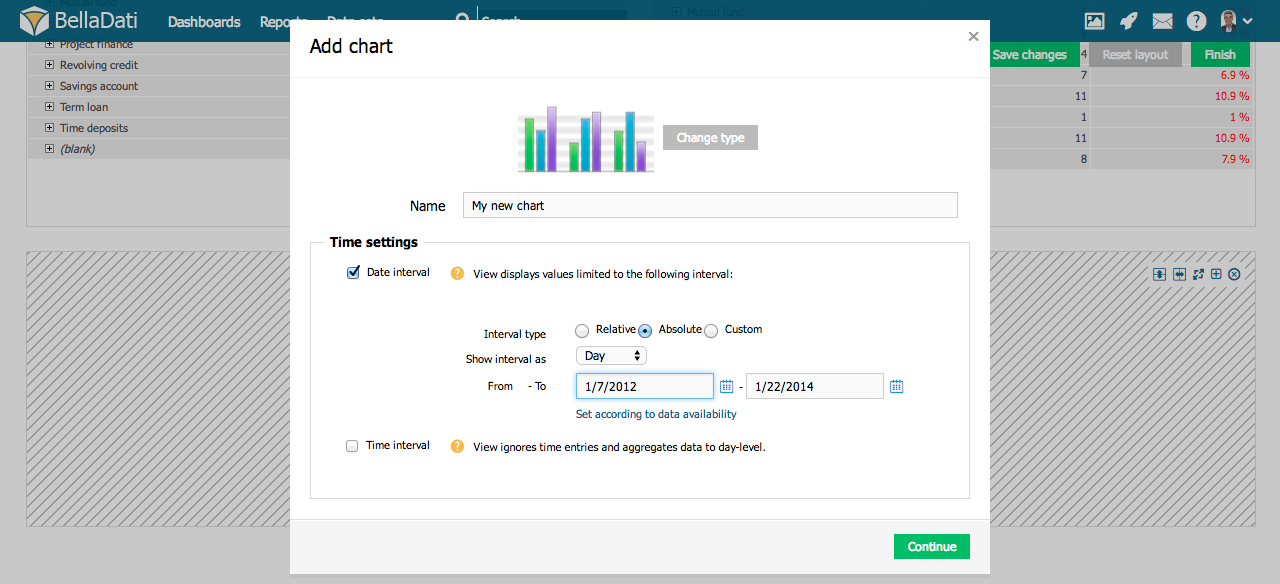
- Add Time axis - continue by Setting Date Interval
- Editing Chart Axes Content
- Change Chart appearance
- Edit Conditional formatting
- Force indicators to Display in the single chart
| Info |
|---|
When more Indicators are added to the chart, they are displayed in separate charts within the view by default. Display in the single chart option forces them to be grouped into single chart. |
Creating
|
| Sv translation | |||||||||||||||||
|---|---|---|---|---|---|---|---|---|---|---|---|---|---|---|---|---|---|
| |||||||||||||||||
Vyberte požadovaný typ grafu. BellaDati Vás následne prevedie všetkými potrebnými nastaveniami.
Správa grafuV hornom pravom rohu nového grafu môžete vykonávať ďalšie operácie:
Nastavenia grafovKliknite na ikonu nástrojov a vyberte Nastavenia grafu, následne sa Vám zobrazí okno Nastavenia grafu. Každý graf zvyčajne obsahuje aspoň jeden ukazovateľ. Nastavenia grafu Vám umožňujú:
Zobrazenie zdrojových dátPre informácie o zobrazovaní zdrojových dát kliknite sem. Kam ďalej |
| Sv translation | |||||||||||||||||||||||||||||||||||||
|---|---|---|---|---|---|---|---|---|---|---|---|---|---|---|---|---|---|---|---|---|---|---|---|---|---|---|---|---|---|---|---|---|---|---|---|---|---|
| |||||||||||||||||||||||||||||||||||||
Vyberte požadovaný typ grafu. BellaDati Vás provede všemi potřebnými nastavení.
Správa grafuV pravém horním rohu vytvořeného grafu můžete vykonat následující operace:
Nastavení grafuKlikněte na ikonu nastavení nebo vyberte Nastavení grafu a zobrazí se Vám dialogové okno Nastavení grafu. Každý graf obsahuje alespoň jeden ukazatel. Dialogové okno Nastavení grafu Vám umožňuje:
Zobrazení zdrojových datPodívejte se, jak tato funkcionalita funguje. Další kroky
チャートの管理挿入されたチャートビューの右上隅で、追加の操作を実行できます:
チャートの設定ツールボックスアイコンをクリックするか、ツールボックスリストから[チャートの設定]を選択して、チャート設定ダイアログに入ります。 通常、各チャートには少なくとも1つのインジケータが含まれます。チャート設定ダイアログでは次のことができます:
ソースデータの表示動作方法はこちら。
|
| Sv translation | |||||||||||||||||
|---|---|---|---|---|---|---|---|---|---|---|---|---|---|---|---|---|---|
| |||||||||||||||||
|
Overview
Content Tools