| Note |
|---|
新しいチャートを作成するには、編集モードにする必要があります。上部のレポートメニューで[編集]をクリックし、 編集モードを有効にします。 |
| Column |
|---|
| 基本のチュートリアル様々な情報のグラフィック表現でグラフ化し、ユーザーの基準に応じてインジケータの値を表示します。 新しいチャートを追加するには、自由な場所にカーソルを合わせて、チャートビュータイプをクリックします。 [チャートを選択する]ダイアログボックスが表示されます。 | | Note |
|---|
Pro vytvoření grafu musíte být v módu úprav. Pro přepnutí do módu úprav klikněte na tlačítko "Upravit" v pravém horním menu reportu. |
| Section |
|---|
| Column |
|---|
Pro přidání nového grafu klikněte na tlačítko Vložit novou buňku, kurzorem myši najeďte nad nově vytvořený pohled a vyberte typ pohledu Graf. Zobrazí se dialogové okno Přidat graf. BellaDati podporuje různé typy grafů: - Koláčový graf
- Sloupcový graf
- Sloupcový součtový graf
- Čárový graf
- Horizontální X Y graf
- X Y graf
- Paprskový graf
- Sloupcový horizontální graf
- Horizontální heat mapa
- Burzovní
- Teploměr
- Trychtýřový
- Tachometr
- Kombinovaný (každý ukazatel může být zobrazený jiným způsobem): sloupcový graf, sloupcový součtový graf, čárový graf, X Y graf
|
| Column |
|---|
| | Panel |
|---|
Na stránce nastavení grafu jsou dostupné: - Výběr typu grafu
- Správa grafu
- Nastavení grafu
- Větvení
- Vlastní hodnoty větvení
- Vzhled grafu
|
|
|
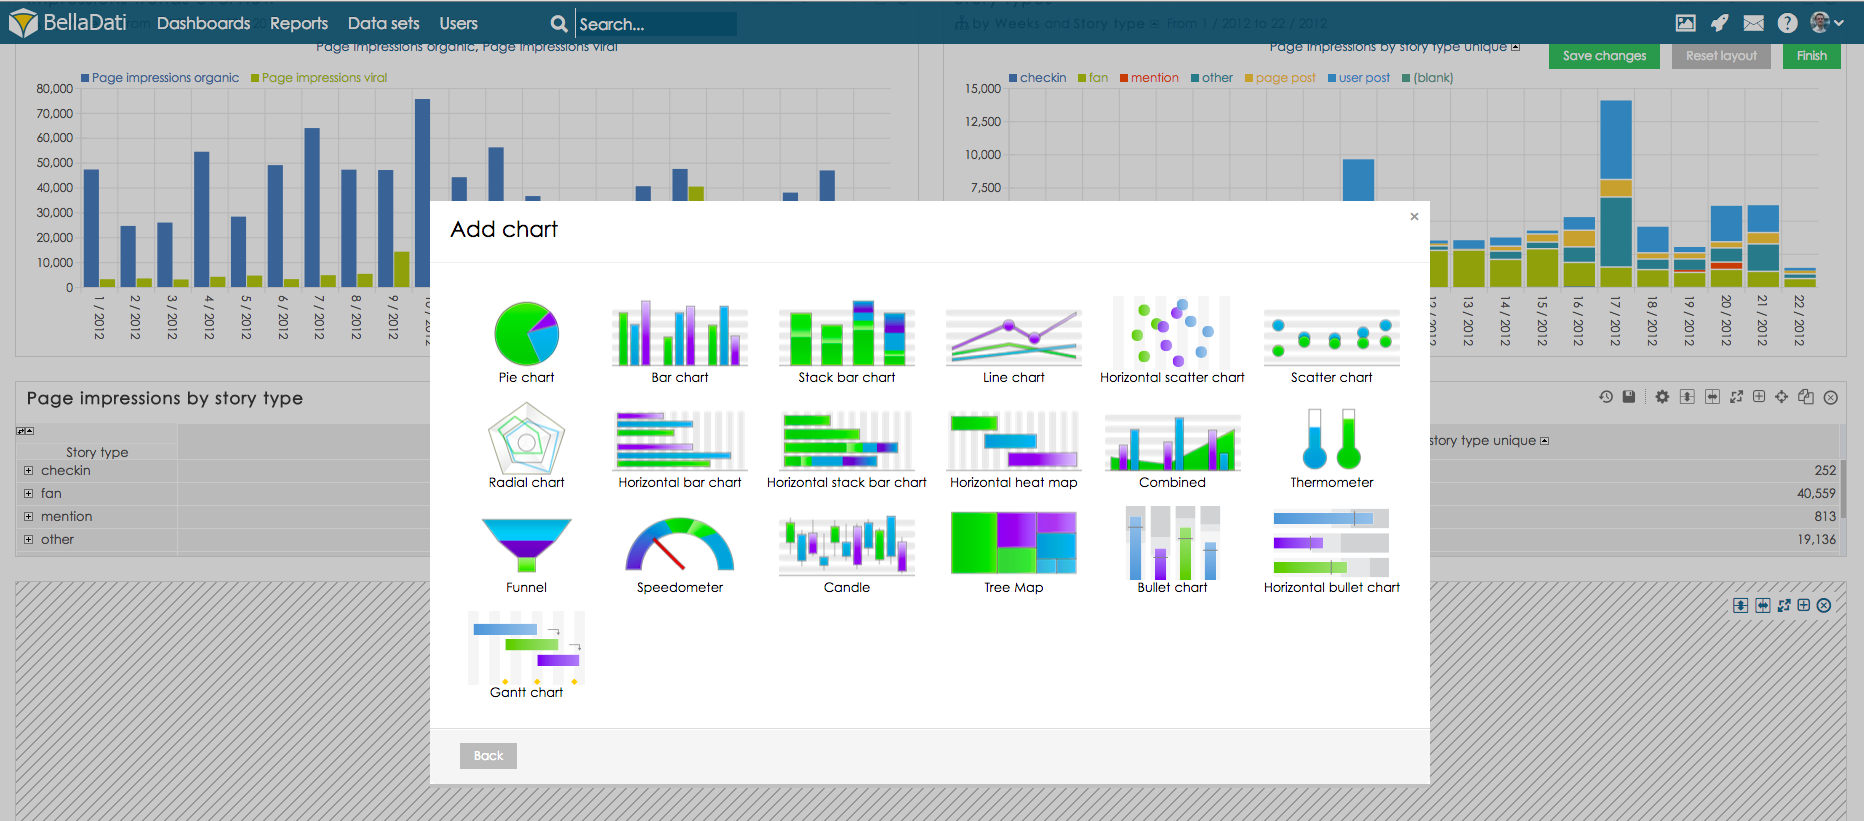 Image Removed Image Removed
Vyberte požadovaný typ grafu. BellaDati Vás provede všemi potřebnými nastavení. - Zadejte název nově vytvořeného grafu.
- Zkontrolujte Časový interval. Pokud potřebujete omezit časový interval pro zobrazená data, přejděte do sekce Nastavení časového intervalu.
- Vyberte a upravte nastavení ukazatelů, které jsou zobrazeny v grafu - pro více informací přejděte do sekce Zobrazení ukazatelů.
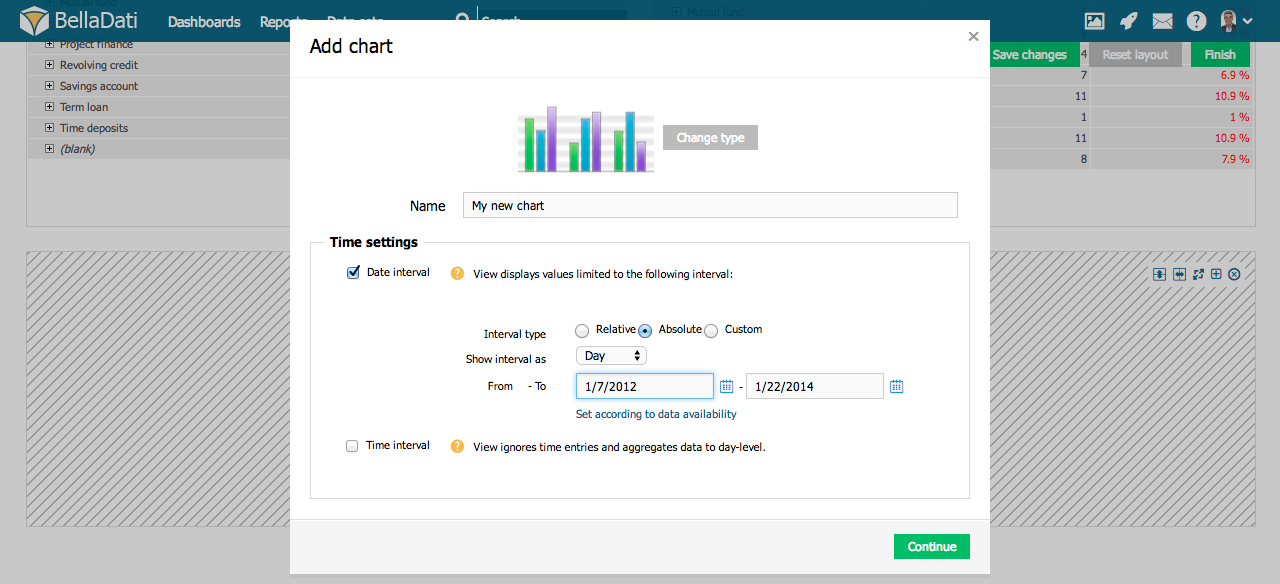 Image Removed Image Removed
Správa grafuV pravém horním rohu vytvořeného grafu můžete vykonat následující operace: | Tip |
|---|
Pro rychlé přidání a odebrání Ukazatelů najeďte kurzorem myši nad ikonu nastavení grafu a následně nad položku Ukazatele. Zobrazené okno Vám následně umožní jednoduché vybrání ukazatele ze zobrazeného seznamu a smazání nepotřebného ukazatele pomocí kliknutí na křížek. |
Nastavení grafuKlikněte na ikonu nastavení nebo vyberte Nastavení grafu a zobrazí se Vám dialogové okno Nastavení grafu. Každý graf obsahuje alespoň jeden ukazatel. Dialogové okno Nastavení grafu Vám umožňuje: - Upravit Ukazatele
- Změnit typ grafu
- Přidat časovou osu
- Upravit obsah osy grafu
- Změnit vzhled grafu
- Upravit podmíněné formátování
- Nastavit zobrazení všech indikátorů v jednom grafu
| Info |
|---|
Pokud je do grafu přidáno více ukazatelů, každý z nich je defaultně zobrazený ve vlastním grafu. Toto nastavení je možné změnit pomocí checkboxu Zobrazit v jednom grafu. |
 Image Removed Image Removed
Zobrazení zdrojových datPodívejte se, jak tato funkcionalita funguje. Další krokyNastavení vzhledu grafuVytvoření Geo mapVytvoření KPI popiskůNastavení časového intervaluZobrazení ukazatelůVytvoření filtrů |
|---|
| - サムネイルのいずれかをクリックし、チャートの種類を選択します。BellaDatiは様々なチャートの種類をサポートしています:
- 円グラフ
- 棒グラフ
- 積み上げ棒グラフ
- 折れ線グラフ
- 水平散布図
- 散布図
- レーダーチャート
- 横棒グラフ
- 積み上げ棒グラフ(水平)
- 水平ヒートマップ
- 複合チャート(各インジケータを別々に表示できます): 棒チャート、積み上げ棒チャート、折れ線チャート、散布図
- 温度計
- じょうごグラフ
- 速度計
- ロウソク足チャート
- ツリーマップ
- ブレットチャート
- 水平ブレットチャート
- ガントチャート
- ヒストグラム
- X/Y散布図
- 箱ひげ図(ボックスプロットチャート)
Image Added - 新しいチャートの名前を入力します。
Image Added - 表示されるデータの期間を制限する必要がある場合は、期間指定をチェックします - Setting Date Intervalに進みます。
[インジケータ]ダイアログボックスからビューにインジケータを追加します。インジケータダイアログボックスは、3つの列に分かれています: - 利用可能なインジケータのリスト
- ビューに表示されたインジケータのリスト
- 選択したインジケータの詳細
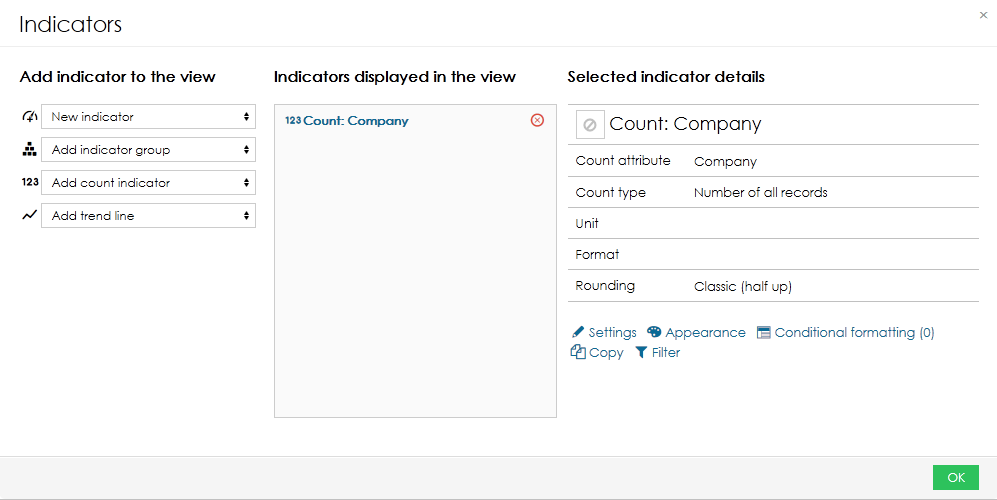 Image Added Image Added
インジケータについての詳細は、Displaying Indicatorsに進んでください。- 1つ以上の属性を選択して、ドリルダウンを追加します。ドリルダウンは、選択したドリルダウンパスに従って粒度を変更するために使用されます。ドリルダウンの設定は、様々なチャートで異なります:
- ほとんどのチャートでは、x軸とy軸の両方にドリルダウンを設定できます。これは以下に適用されます:
- 棒グラフ
- 積み上げ棒グラフ
- 折れ線グラフ
- 水平散布図
- 散布図
- レーダーチャート
- 横棒グラフ
- 水平ヒートマップ
- 複合チャート
- 一部のチャートでは、ドリルダウンが1つだけ許可されています:
- 円グラフ – 補助的なドリルダウンを設定することもできます – [詳細を表示]オプションの使用
- ロウソク足チャート
- 温度計
- じょうごグラフ
- 速度計
- ブレットチャート
- 水平ブレットチャート
- ガントチャート
次の2つの基本タイプのドリルダウンを使用できます:
通常の属性によるドリルダウン - 粒度を変更するには、市、国、部門、顧客などの属性を使用します。
日付や時刻によるドリルダウン。次の日付集計を軸に配置できます:
 Image Added Image Added
詳細については、Editing Chart Axes Contentに進んでください。
- [OK]をクリックして、チャートの作成を終了します。または、チャートの詳細設定と外観を編集できます。
|
|
チャートの管理挿入されたチャートビューの右上隅で、追加の操作を実行できます: | Tip |
|---|
ツールボックスリストのインジケータにカーソルを合わせると、インジケータをすばやく追加、削除できます。属性をすばやく追加、削除するには、ツールボックスリストのドリルダウンパスにカーソルを合わせます。 |
チャートの設定ツールボックスアイコンをクリックするか、ツールボックスリストから[チャートの設定]を選択して、チャート設定ダイアログに入ります。 通常、各チャートには少なくとも1つのインジケータが含まれます。チャート設定ダイアログでは次のことができます: | Info |
|---|
さらにインジケータがチャートに追加されると、デフォルトでビュー内の別々のチャートに表示されます。[シングルチャート表示]オプションは、それらを強制的に単一チャートにグループ化します。 |
Image Added
ソースデータの表示動作方法はこちら。
|