Page History
| Sv translation | ||||||||||||||||||||
|---|---|---|---|---|---|---|---|---|---|---|---|---|---|---|---|---|---|---|---|---|
| ||||||||||||||||||||
| ||||||||||||||||||||
|
|
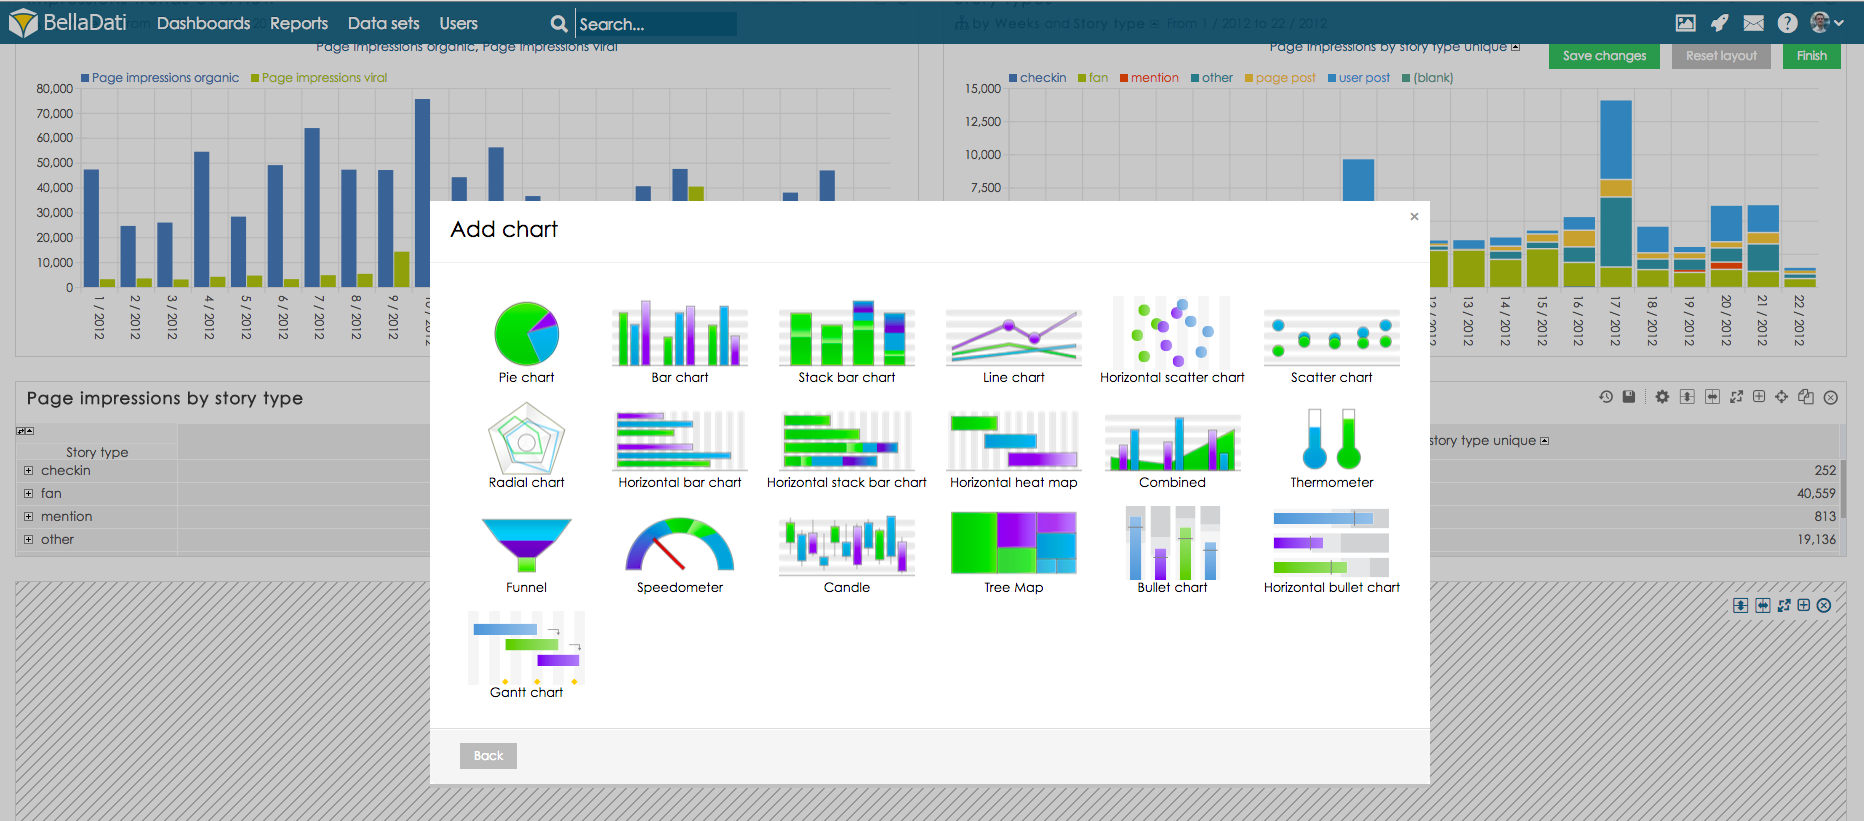
Select desired chart type. BellaDati will guide you through additional setup.
- Enter name of the new chart.
- Check Date interval if you need to restrict time period of displayed data - continue by Setting Date Interval.
- Select and edit Indicators displayed in the chart - continue by Displaying Indicators.
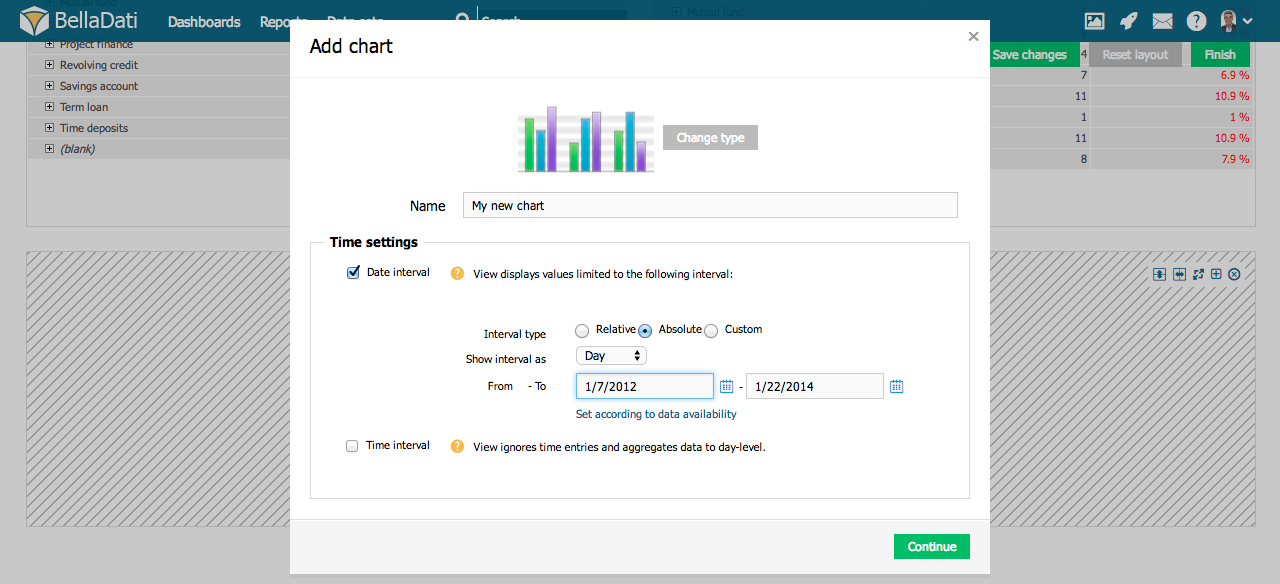
Chart management
You can perform additional operations in the upper right corner of the inserted Chart view:
- Chart settings
- Drill down paths
- Indicators
- Chart appearance
- Filter setting - continue by Using Filters
- Export view - continue by Exporting View
- Add to dashboard
- Move chart
- Duplicate chart
- Delete chart
| Tip |
|---|
Hover over Indicators in the toolbox list to quickly add or remove indicators. Hover over Drill down path in the toolbox list to quickly add or remove attributes. |
Chart Settings
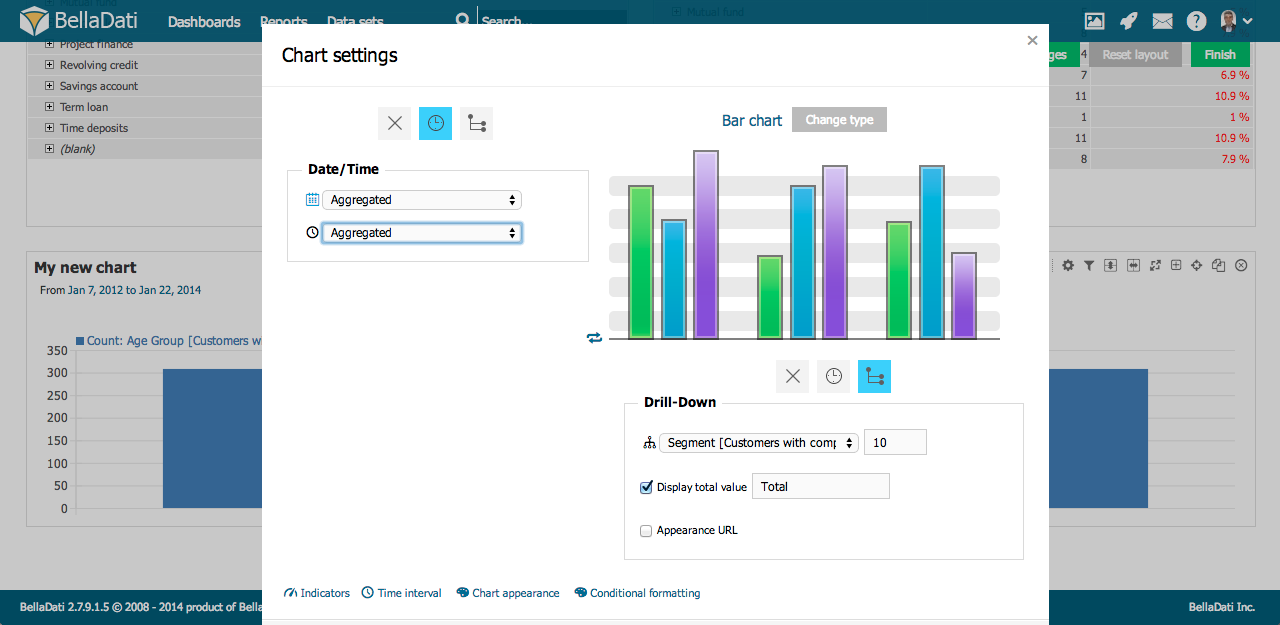
Click on toolbox icon or select Chart settings from the toolbox list to enter Chart settings dialog.
Each chart usually contains at least one indicator. Chart settings dialog allows you to:
- Edit Indicators
- Change type of the chart
- Add Time axis - continue by Setting Date Interval
- Editing Chart Axes Content
- Change Chart appearance
- Edit Conditional formatting
- Force indicators to Display in the single chart
| Info |
|---|
When more Indicators are added to the chart, they are displayed in separate charts within the view by default. Display in the single chart option forces them to be grouped into single chart. |
Displaying Source Data
See how it works.
Next steps
| Sv translation | |||||||||||||||||
|---|---|---|---|---|---|---|---|---|---|---|---|---|---|---|---|---|---|
| |||||||||||||||||
Vyberte požadovaný typ grafu. BellaDati Vás následne prevedie všetkými potrebnými nastaveniami.
Správa grafuV hornom pravom rohu nového grafu môžete vykonávať ďalšie operácie:
Nastavenia grafovKliknite na ikonu nástrojov a vyberte Nastavenia grafu, následne sa Vám zobrazí okno Nastavenia grafu. Každý graf zvyčajne obsahuje aspoň jeden ukazovateľ. Nastavenia grafu Vám umožňujú:
Zobrazenie zdrojových dátPre informácie o zobrazovaní zdrojových dát kliknite sem. Kam ďalej |
...
Overview
Content Tools