Versions Compared

Key

  • This line was added.
  • This line was removed.
  • Formatting was changed.
Sv translation
languageen

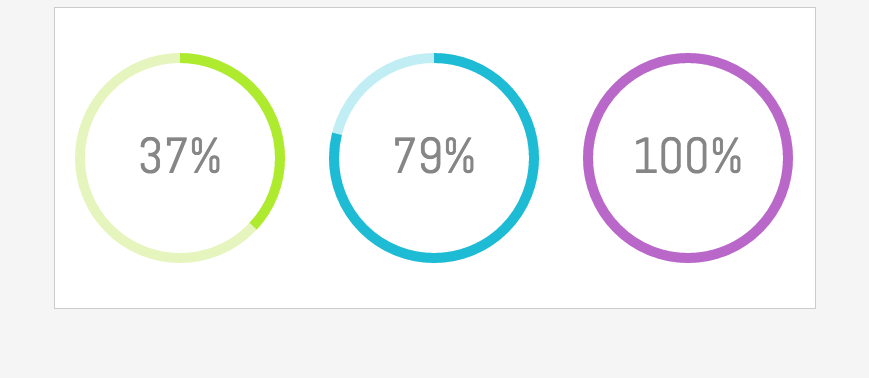
In this tutorial you will obtain data from existing BellaDati chart view using Client API and create a custom visualization.

Result will look like this:

Info

All of this will be accomplished using BellaDati Client API, JavaScript, JQuery and HTML5 canvas.


Tutorial parts:

  • Working with BellaDati Extensions
  • Getting data from BellaDati chart view
  • Creating custom chart


Working with BellaDati Extensions

Before you start with Client API you have to learn how create BellaDati Extension.

Extensions allow you to to customize BellaDati front-end functions or create custom content like charts or dashboards.


This function is available for System administrators. Access it by going to Administration - Advanced settings - Extensions.

Extensions consist of three parts: External JavaScript libraries, code that is appended to the end of head element content and code that is appended to the beginning of body.


First give your extension a name.

Next create layout of the Extension where the custom chart will be placed:

Code Block
languagexml
<div id="wrapper">
<div id="view1" class="view">
<canvas id="canvas1" class="canvas" width="250" height="250"></canvas>
</div>
<div id="view2" class="view">
<canvas id="canvas2" class="canvas" width="250" height="250"></canvas>	
</div>
<div id="view3" class="view">
<canvas id="canvas3" class="canvas" width="250" height="250"></canvas>	
</div>
</div>
Info

Place the code to the Beginning of the body.


Then style the layout:

Code Block
languagecss
<style>
body {
	background-color: #F5F5F5 ;
}
	
.canvas {
    display: block;
    padding-left: 0;
    padding-right: 0;
    margin-left: auto;
    margin-right: auto;
  	padding-top: 10%;
}
.view {
	display: inline-block;
}
#wrapper {
	width: 760px;
	height: 300px;
	display: block;
    padding-left: 0;
    padding-right: 0;
    margin-left: auto;
    margin-right: auto;
    background-color: #fff;
    border: 1px solid #ccc;
}
</style>
Info

Place the code to the End of head.


Extension is now created so you can continue with the next part.


Getting data from BellaDati

This example is based on Speedometer chart. To keep it simple you will work only with one indicator value.

For this case let's assume that there is a formula indicator calculating a percentage value - so the value you get is always in 0 - 100 range.


You can download this BellaApp and upload it into BellaDati. It contains data set and report created following steps below.

  • Create a data set with three indicators and insert a value between 0 - 100 using browse data.
  • In the next step create a report based on previously created data set.
  • Insert 3 views and to each add a Speedometer chart with previously created indicator.


Everything is now ready so you can start with getting the data from the chart view.

Info

User has to have access permission to the source report. Otherwise the data from the chart cannot be obtained.


Click on the view from which you want to get a value with right mouse button and select "Inspect".

You can find the view's ID in the element of this view. It looks like "8313-0dt2jiMsXY" with "8313" being ID of the report and "0dt2jiMsXY" being ID of the view.


Now to loading the data.

Create a function with Ajax call to get data from the chart using the viewDetail endpoint so it can be later used for rendering a chart. See http://support.belladati.com/techdoc/Report+API for all Report API endpoints.

Code Block
languagejs
function loadData() {

			$.ajax({ 
	                    url: "/bi/report/api:viewDetail/reportID-viewID",	// for example "/bi/report/api:viewDetail/8306-Ua0dyvh7lc"
	                    success: function(chartReply) {
	                      var value = chartReply.data.elements[0].values[0].value; // assign the value from the chart to variable
	                      console.log(value);	// check if the code above is correct
	                    }
	                  });
		}
	loadData();

Chart data are returned in a JSON and the indicator value can be accessed using this path:

Code Block
languagejs
var value = chartReply.data.elements[0].values[0].value;


Check in the JavaScript console if your code is correct and you can see the value of the indicator from the chart.


Creating custom chart

Now that you have the value you can start building a chart.

In this example is a simple gauge created using HTML5 canvas.

In this custom chart the value you get from a chart is used to calculate radius of the gauge that will be filled and is also displayed as a percentual value inside of the gauge.

The value is rounded to the nearest integer to make it more clean in this example.

createGauge function that creates the chart has 4 parameters. ID of the canvas element in your Extension, ID of the chart view in BellaDati, color of the Guage background and color of the space that is filled.

Code Block
languagejs
function createGauge(canvasID, viewID, color, bgcolor)
	{
		//canvas initialization
		var canvas = document.getElementById(canvasID);
		var ctx = canvas.getContext("2d");
		//dimensions
		var W = canvas.width;
		var H = canvas.height;
		//Variables
		var chartData;
		var degrees = 0;
		var new_degrees = 0;
		var difference = 0;
		var text;
		var animation_loop;

		//previsouly created function to load the value
		function loadData() {
			$.ajax({ 
	                    url: "/bi/report/api:viewDetail/" + viewID,
	                    success: function(chartReply) {
	                      var value = chartReply.data.elements[0].values[0].value;
	                      chartData = Math.round(value*3.6);	//transform the value to degrees and round it
	                      draw();                      
	                    }
	                  });
					}
		loadData();
		
		function init()
		{
			//Clear the canvas everytime a chart is drawn
			ctx.clearRect(0, 0, W, H);
			
			//Background 360 degree arc
			ctx.beginPath();
			ctx.strokeStyle = bgcolor;	// color of the background
			ctx.lineWidth = 10;
			ctx.arc(W/2, H/2, 100, 0, Math.PI*2, false);
			ctx.stroke();
			
			//gauge will be a simple arc
			//Angle in radians = angle in degrees * PI / 180
			var radians = degrees * Math.PI / 180;
			ctx.beginPath();
			ctx.strokeStyle = color;	//color of the filled space
			ctx.lineWidth = 10;
			//The arc starts from the rightmost end. If we deduct 90 degrees from the angles
			//the arc will start from the topmost end
			ctx.arc(W/2, H/2, 100, 0 - 90*Math.PI/180, radians - 90*Math.PI/180, false); 
			//you can see the arc now
			ctx.stroke();
			
			//Lets add the text
			ctx.fillStyle = "#868686";	//color of the text
			ctx.font = "50px Abel";
			text = Math.round(degrees/360*100) + "%";
			//center the text
			//deducting half of text width from position x
			text_width = ctx.measureText(text).width;
			//adding manual value to position y
			ctx.fillText(text, W/2 - text_width/2, H/2 + 15);
		}
		
		function draw()
		{
			//Cancel any movement animation if a new chart is requested
			if(typeof animation_loop != undefined) clearInterval(animation_loop);
			
			//get degrees that could be filled
			new_degrees = chartData;
			difference = new_degrees - degrees;
			//This will animate the gauge to new position
			//The animation will take 1 second
			//time for each frame is 1sec / difference in degrees
			animation_loop = setInterval(animate_to, 1000/difference);
		}
		
		//function to make the chart move to new degrees
		function animate_to()
		{
			//clear animation loop if degrees reaches to new_degrees
			if(degrees == new_degrees || new_degrees === undefined) 
				clearInterval(animation_loop);
					
			if(degrees < new_degrees)
				degrees++;
		
			init();
		}
	}


Create gauges in canvas elements using these parameters:

Code Block
languagejs
function renderGauges() 
		{
		 createGauge("canvas1", "viewId1", "#AEEA2E", "#E6F5BE"); // e.g.: createGauge("canvas1", "8306-k1LELScByj", "#AEEA2E", "#E6F5BE"); 
		 createGauge("canvas2", "viewId2", "#1EBBD4", "#C1EEF4"); // make sure you are using correct ID of the view  
		 createGauge("canvas3", "viewId3", "#B967C9", "#EED9F0");
		} 
		renderGauges();


As the last step add font that is used inside of the gauge:

Code Block
languagexml
<link href='https://fonts.googleapis.com/css?family=Abel' rel='stylesheet' type='text/css'>
Info

Place the code to the End of head.


You have created a view with multiple charts displaying live data from BellaDati. This view can be used for example in custom reports or dashboards.

Complete code is available here - End of Head + Beginning of body.

Sv translation
languageja

このチュートリアルでは、クライアントAPIを使用して、既存のBellaDati可視化ビューからデータを取得し、カスタムグラフを作成する。このチュートリアルでは、クライアントAPIを使用して既存のBellaDatiチャートビューからデータを取得し、カスタムビジュアライゼーションを作成します。

その結果がこのようなダッシュボードに統合される。結果は次のようになります:

Info

このすべてがBellaDatiクライアントAPI、JavaScript、jQueryとHTML5のキャンバスを使用して達成される。


これらはすべて、BellaDatiクライアントAPI、JavaScript、JQuery、HTML5キャンバスを使用して実行されます。


チュートリアルパーツ:

  • BellaDati拡張機能で作業BellaDati拡張機能の操作
  • BellaDatiチャートビューからデータを取得
  • カスタムチャートを作成カスタムチャートの作成


BellaDati拡張機能の操作

BellaDati拡張機能で作業

クライアントAPIを開始する前に、BellaDati拡張機能の作成方法を学ぶ必要があります。

クライアントAPIで開始する前に、BellaDatiエクステンションを作成方法を学習する必要がある。

拡張機能を使用すると、BellaDatiフロントエンド機能をカスタマイズしたり、チャートやダッシュボードなどのカスタムコンテンツを作成することを可能にする。

拡張機能を使用すると、BellaDatiフロントエンド機能をカスタマイズしたり、チャートやダッシュボードなどのカスタムコンテンツを作成したりできます。


この機能は、システム管理者が利用できます。 [管理]-[拡張機能]に移動してアクセスします。この機能は、システム管理者のために利用可能です。拡張-拡張設定 -  拡張機能-管理に行くことによるアクセスする。

拡張機能は、3つの部分で構成されている:外部JavaScriptライブラリ、コード本文の先頭に追加されたヘッド素子コンテンツや末尾に追加されたコード。拡張機能は、外部JavaScriptライブラリ、head要素のコンテンツの最後に追加されるコード、bodyの最初に追加されるコードの3つの部分で構成されます。


 まず、拡張機能に名前を付けます。 

まず、あなたの拡張機能に名前を付ける。

次のカスタムチャートが配置される拡張機能のレイアウトを作成する。

次に、カスタムチャートが配置される拡張機能のレイアウトを作成します:

Code Block
languagexml
<div id="wrapper">
<div id="view1" class="view">
<canvas id="canvas1" class="canvas" width="250" height="250"></canvas>
</div>
<div id="view2" class="view">
<canvas id="canvas2" class="canvas" width="250" height="250"></canvas>	
</div>
<div id="view3" class="view">
<canvas id="canvas3" class="canvas" width="250" height="250"></canvas>	
</div>
</div>


Info

本文の先頭にコードを配置する。


コードをbodyの先頭に配置します。


次に、レイアウトのスタイルを設定します:その後レイアウトのスタイルする

Code Block
languagecss
<style>
body {
	background-color: #F5F5F5 ;
}
	
.canvas {
    display: block;
    padding-left: 0;
    padding-right: 0;
    margin-left: auto;
    margin-right: auto;
  	padding-top: 10%;
}
.view {
	display: inline-block;
}
#wrapper {
	width: 760px;
	height: 300px;
	display: block;
    padding-left: 0;
    padding-right: 0;
    margin-left: auto;
    margin-right: auto;
    background-color: #fff;
    border: 1px solid #ccc;
}
</style>


Info

ヘッドのエンドにコードを配置する。コードをheadの終わりに配置します。


 これで拡張機能が作成され、次のパートに進むことができます。

拡張が次の部分を続けることができるように作成されない。


BellaDatiからデータを取得

この例では、スピードメーターチャートに基づく。シンプルに唯一のインジケータ値で動作することだけ

この例に対してあなたが得る値は0- 100の範囲このケースでのがパーセント値を計算式インジケータがあると仮定しましょう。

この例は、スピードメーターチャートに基づいています。簡単にするために、1つのインジケータ値のみを使用します。

この場合、パーセンテージ値を計算する数式インジケータがあると仮定します。従って、取得する値は常に0〜100の範囲にあります。 


このBellaAppをダウンロードして、BellaDatiにそれをアップロードできる。これはデータセットが含まれて、作成したレポートが次の手順の通りです。

  • 3つのインジケータを用いてデータセットを作成し、- ブラウズ・データを使用している0-100値を挿入する。
  • 次のステップでは、以前に作成したデータセットに基づいてレポートを作成する。
  • 3つのビューを挿入し、それぞれに、以前に作成した指標でスピードメーターチャートを追加する。


すべての準備が整いましたのであなたがチャートビューからデータを取得して起動できる。

Info

ユーザーがソースレポートへのアクセス権を持っている必要がある。そうでなければ、チャートからデータを得ることができない。


マウスの右ボタンで値を取得したいビューフォームをクリックして、「Inspect」を選択する。

Image Removed

あなたは、このビューの要素にビューのIDを見つけることができる。それは、「8313-0dt2jiMsXY」と「8313」レポートのあるIDとビューの「0dt2jiMsXY」というIDのように見える。

Image Removed


今すぐデータをロードする。

をダウンロードして、BellaDatiにそれをアップロードできます。これには、以下の手順に従って作成されたデータセットとレポートが含まれています。

  • 3つのインジケータを使用してデータセットを作成し、ブラウズデータを使用して0〜100の値を挿入します。
  • 次のステップでは、以前に作成したデータセットに基づいてレポートを作成します。
  • 3つのビューを挿入し、それぞれに以前に作成したインジケータ付きのスピードメーターチャートを追加します。


これですべての準備が整いましたので、チャートビューからデータを取得することから始めることができます。

Info

ユーザーは、ソースレポートへのアクセス許可を持っている必要があります。そうしないと、チャートのデータを取得できません。


マウスの右ボタンで値を取得するビューをクリックし、[Inspect(検査)] を選択します。

Image Added

ビューのIDは、このビューの要素にあります。"8313-0dt2jiMsXY"..."8313" はレポートのIDで、"0dt2jiMsXYはビューのIDです。

Image Added


次に、データをロードします。

後でチャートのレンダリングに使用できるように、viewDetailエンドポイントを使用してチャートからデータを取得するAjaxコールを使用して関数を作成します。すべてのレポートAPIエンドポイントについては、それは後でチャートを描画するために使用することができるようviewDetailエンドポイントを使用してグラフからデータを取得するためにAjax呼び出しを持つ関数を作成する。すべてのレポートのAPIエンドポイントのhttp://support.belladati.com/techdoc/Report+APIを参照してください。 を参照してください。

Code Block
languagejs
function loadData() {

			$.ajax({ 
	                    url: "/bi/report/api:viewDetail/reportID-viewID",	// for example "/bi/report/api:viewDetail/8306-Ua0dyvh7lc"
	                    success: function(chartReply) {
	                      var value = chartReply.data.elements[0].values[0].value; // assign the value from the chart to variable
	                      console.log(value);	// check if the code above is correct
	                    }
	                  });
		}
	loadData();

チャートデータはJSONで返され、指標値はこのパスを使用してアクセスできる。チャートデータはJSONで返され、インジケータ値には次のパスを使用してアクセスできます:

Code Block
languagejs
var value = chartReply.data.elements[0].values[0].value;


 コードが正しく、チャートからインジケータの値を確認できるかどうかをJavaScriptコンソールで確認してください。


あなたのコードが正しいかどうかのJavaScriptコンソールで確認してください、あなたは、チャートからのインジケータの値を見ることができる。


カスタムチャートの作成 

カスタムチャート作成

値が得られたので、チャートの作成を開始できます。

 この例では、HTML5キャンバスを使用して作成されたシンプルなゲージです。

今、あなたが値を持って、チャートの構築を開始できる。このカスタムチャートでは、チャートから取得した値を使用して、塗りつぶされるゲージの半径を計算し、ゲージ内のパーセント値としても表示されます。

この例では、HTML5のキャンバスを使用することで作成された簡単なゲージです。

このカスタムでチャートから取得する値がゲージの内側パーセント値として表示されるゲージの半径を計算するために使用される。

この例では、よりきれいにするために、値が最も近い整数に丸められる。

この例では、値をよりクリーンにするために、値は最も近い整数に丸められます。

チャートを作成するcreateGauge関数には、4つのパラメーターがあります。拡張機能のキャンバス要素のID、BellaDatiのチャートビューのID、ゲージの背景の色、塗りつぶされたスペースの色。チャートを作成するcreateGauge機能は4つのパラメータがある。あなたの拡張機能でcanvas要素のID、BellaDatiにチャートビューのID、ゲージの背景の色と空間での色が満たされた。

Code Block
languagejs
function createGauge(canvasID, viewID, color, bgcolor)
	{
		//canvas initialization
		var canvas = document.getElementById(canvasID);
		var ctx = canvas.getContext("2d");
		//dimensions
		var W = canvas.width;
		var H = canvas.height;
		//Variables
		var chartData;
		var degrees = 0;
		var new_degrees = 0;
		var difference = 0;
		var text;
		var animation_loop;

		//previsouly created function to load the value
		function loadData() {
			$.ajax({ 
	                    url: "/bi/report/api:viewDetail/" + viewID,
	                    success: function(chartReply) {
	                      var value = chartReply.data.elements[0].values[0].value;
	                      chartData = Math.round(value*3.6);	//transform the value to degrees and round it
	                      draw();                      
	                    }
	                  });
					}
		loadData();
		
		function init()
		{
			//Clear the canvas everytime a chart is drawn
			ctx.clearRect(0, 0, W, H);
			
			//Background 360 degree arc
			ctx.beginPath();
			ctx.strokeStyle = bgcolor;	// color of the background
			ctx.lineWidth = 10;
			ctx.arc(W/2, H/2, 100, 0, Math.PI*2, false);
			ctx.stroke();
			
			//gauge will be a simple arc
			//Angle in radians = angle in degrees * PI / 180
			var radians = degrees * Math.PI / 180;
			ctx.beginPath();
			ctx.strokeStyle = color;	//color of the filled space
			ctx.lineWidth = 10;
			//The arc starts from the rightmost end. If we deduct 90 degrees from the angles
			//the arc will start from the topmost end
			ctx.arc(W/2, H/2, 100, 0 - 90*Math.PI/180, radians - 90*Math.PI/180, false); 
			//you can see the arc now
			ctx.stroke();
			
			//Lets add the text
			ctx.fillStyle = "#868686";	//color of the text
			ctx.font = "50px Abel";
			text = Math.round(degrees/360*100) + "%";
			//center the text
			//deducting half of text width from position x
			text_width = ctx.measureText(text).width;
			//adding manual value to position y
			ctx.fillText(text, W/2 - text_width/2, H/2 + 15);
		}
		
		function draw()
		{
			//Cancel any movement animation if a new chart is requested
			if(typeof animation_loop != undefined) clearInterval(animation_loop);
			
			//get degrees that could be filled
			new_degrees = chartData;
			difference = new_degrees - degrees;
			//This will animate the gauge to new position
			//The animation will take 1 second
			//time for each frame is 1sec / difference in degrees
			animation_loop = setInterval(animate_to, 1000/difference);
		}
		
		//function to make the chart move to new degrees
		function animate_to()
		{
			//clear animation loop if degrees reaches to new_degrees
			if(degrees == new_degrees || new_degrees === undefined) 
				clearInterval(animation_loop);
					
			if(degrees < new_degrees)
				degrees++;
		
			init();
		}
	}


 次のパラメーターを使用して、キャンバス要素にゲージを作成します:

これらのパラメータを使用して、canvas要素でゲージを作成する。

Code Block
languagejs
function renderGauges() 
		{
		 createGauge("canvas1", "viewId1", "#AEEA2E", "#E6F5BE"); // e.g.: createGauge("canvas1", "8306-k1LELScByj", "#AEEA2E", "#E6F5BE"); 
		 createGauge("canvas2", "viewId2", "#1EBBD4", "#C1EEF4"); // make sure you are using correct ID of the view  
		 createGauge("canvas3", "viewId3", "#B967C9", "#EED9F0");
		} 
		renderGauges();


 最後のステップとして、ゲージ内で使用されるフォントを追加します:

最後のステップとして計の内部で使用されているフォントを追加する。

Code Block
languagexml
<link href='https://fonts.googleapis.com/css?family=Abel' rel='stylesheet' type='text/css'>


Info

ヘッドのエンドにコードを配置する。コードをheadの終わりに配置します。


 BellaDatiからのライブデータを表示する複数のチャートでビューを作成しました。このビューは、例えばカスタムレポートやダッシュボードで使用できます。

あなたはBellaDatiからライブデータを表示する複数のチャートを持つビューを作成した。このビューは、カスタムレポートやダッシュボードの例に使用できる。

完全なコードはここにある - ヘッドの終わり+ボディの始まり完全なコードはここから入手できます - End of Head + Beginning of body