Page History
| Sv translation | |||||||||||||||||||||||||||||||||||||||||||||||
|---|---|---|---|---|---|---|---|---|---|---|---|---|---|---|---|---|---|---|---|---|---|---|---|---|---|---|---|---|---|---|---|---|---|---|---|---|---|---|---|---|---|---|---|---|---|---|---|
| |||||||||||||||||||||||||||||||||||||||||||||||
To be able to see the results and work with them, the results from a project needs to be stored. There are different ways of storing data in BellaDati ML Studio - permanently and temporarily. For storing the data permanently, they need to be stored in data set. Temporary storage is available only for current session. Tables and various charts can be used as temporary storage (temporary output). These tables and charts are deleted after end of each session. Storing data Permanently in Data SetTo be able to store data in data set, the data set with correct structure (attribute and indicators) needs to be already created. See Creating Data Set for more information. Function storeDataset is used for storing the data. The function is defined like this:
ParametersAll parameters are mandatory.
Sample usage
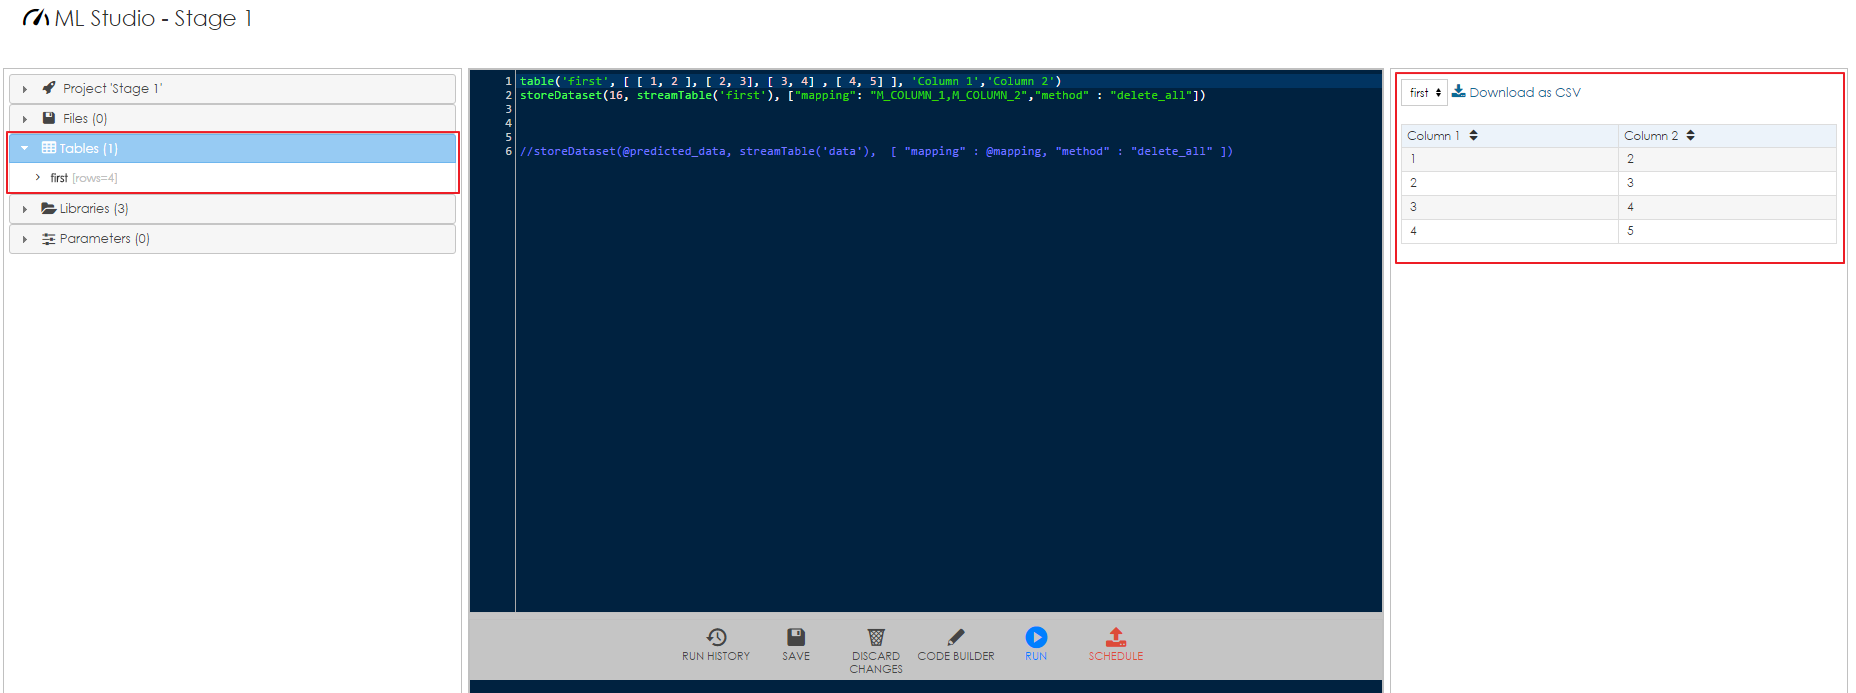
This code will first create a temporary table 'temptable' and then store in data set with ID 16. First column of the table is mapped to indicator with code M_COLUMN_1, second column is mapped to indicator with code M_COLUMN_2. Method delete_all is used and therefore all existing data in the target data set will be deleted before storing data from the table.
This code will first create a temporary table 'temptable2' with one column and then store in data set with ID 17. The column of the table is mapped to indicator with code M_COLUMN_1. Second column with code M_COLUMN_2 will be filled with number 10 (all rows). Method delete_all is used and therefore all existing data in the target data set will be deleted before storing data from the table. Storing Data TemporarilyData can temporarily stored (displayed) as:
Storing data in tableTemporary table can be used for displaying results in a form of rows and columns. List of tables is displayed in control sidebar on left side of the screen in section Tables. The table itself is displayed in the right sidebar. It is also available to download it as a CSV file.
Function table is used for storing the data in table. The function is defined like this:
ParametersParameter data is mandatory, parameters id and columns are optional.
Sample usage
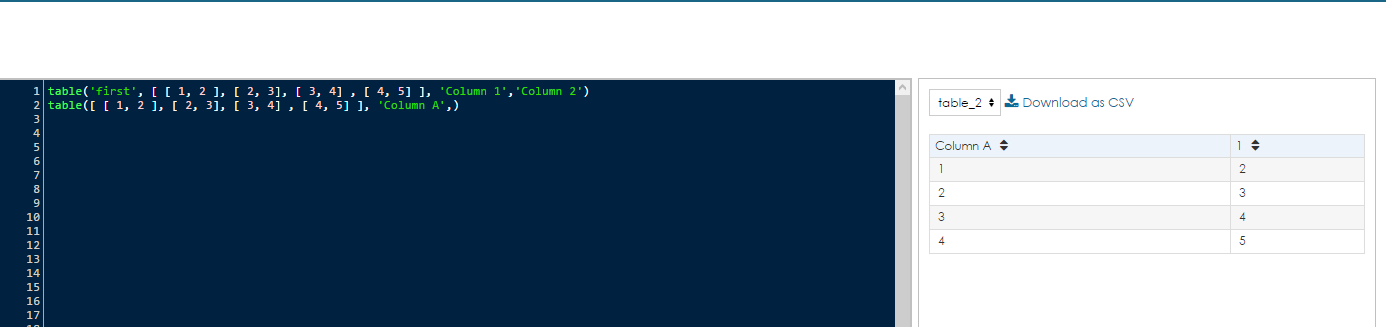
This code will create two tables with the same content. The first table has defined its name and names of both columns. Second table does not have its name defined and therefore it will be named as table_2. It also has defined name only for the first column. The second will be named automatically as 1.
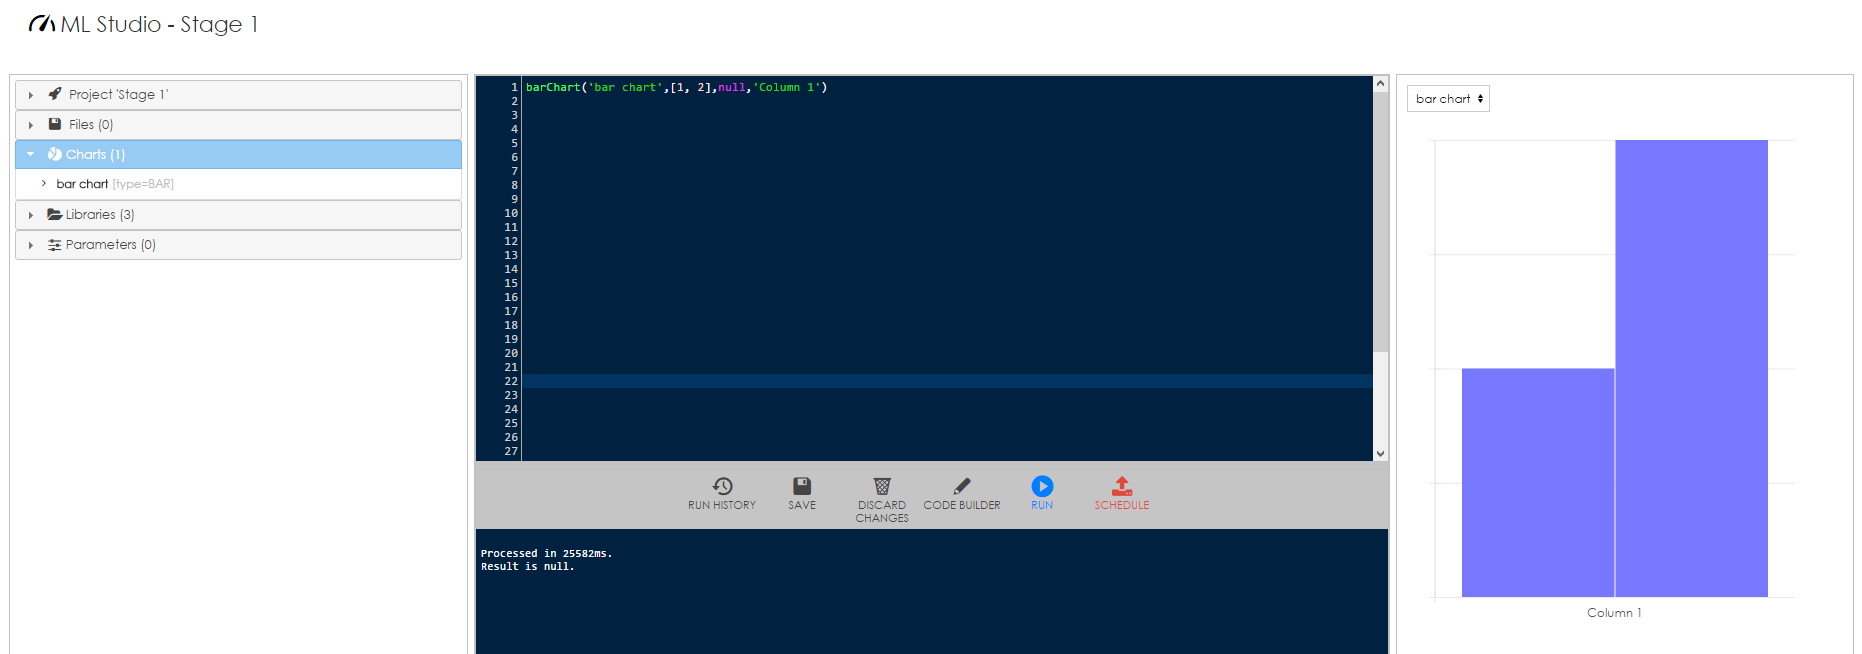
Displaying data in bar chartIt is possible to display results in a form of a bar chart. List of charts is displayed in control sidebar on left side of the screen in section Charts. The chart itself is displayed in the right sidebar.
Function barChart is used for displaying the data as a bar chart. The function is defined like this:
ParametersParameter data is mandatory, parameters id, params and columns are optional.
Sample usage
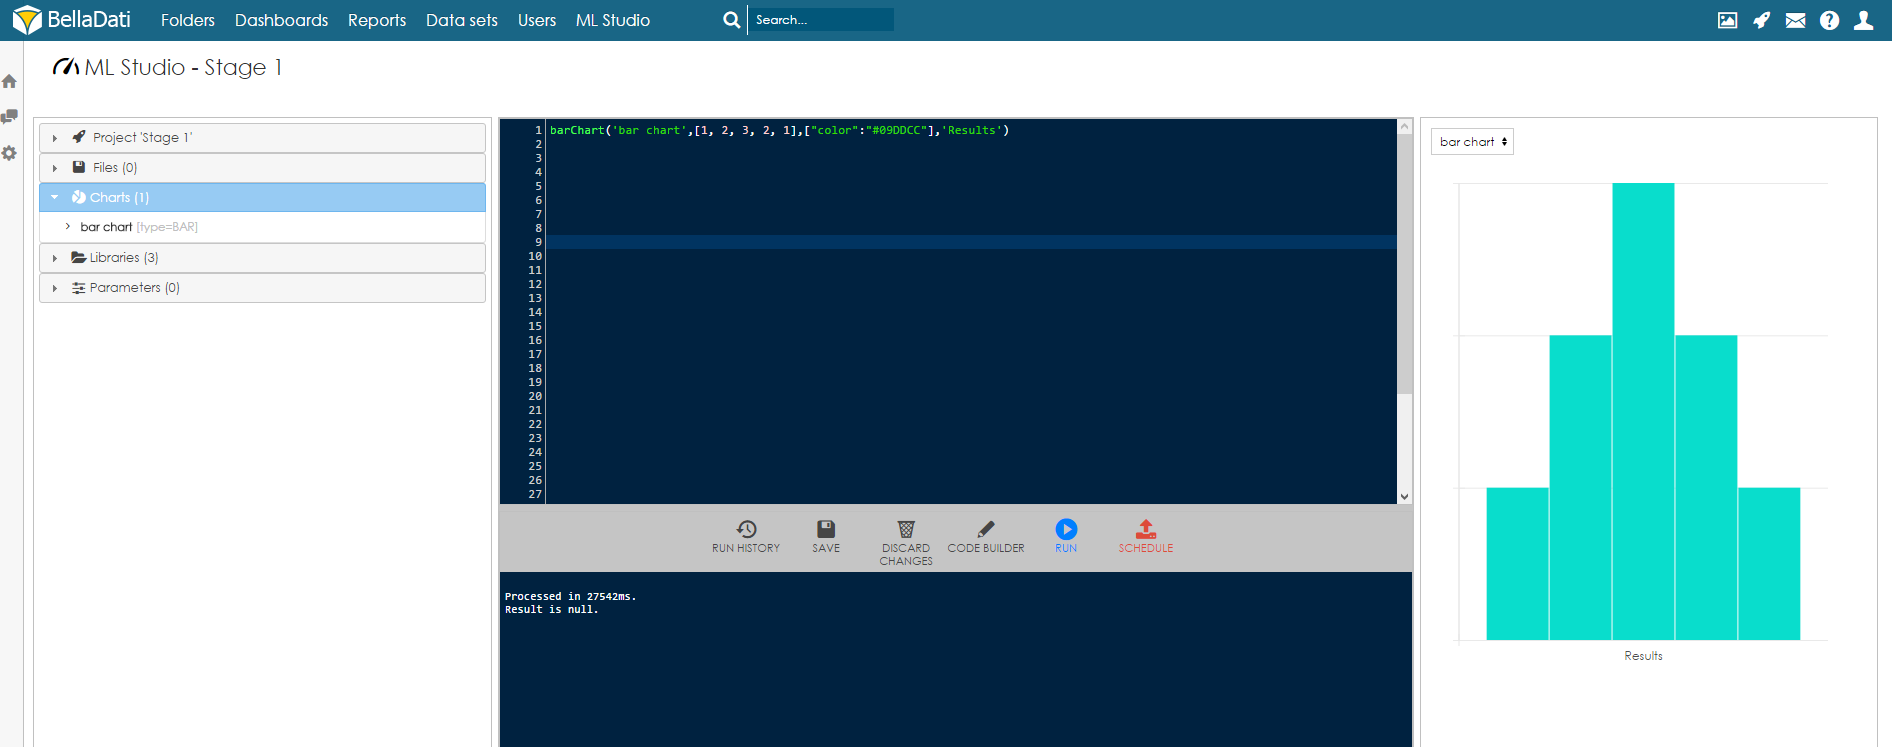
This code will create a bar chart with the name "bar chart", with five columns, cyan color and label "Results" on X axis.
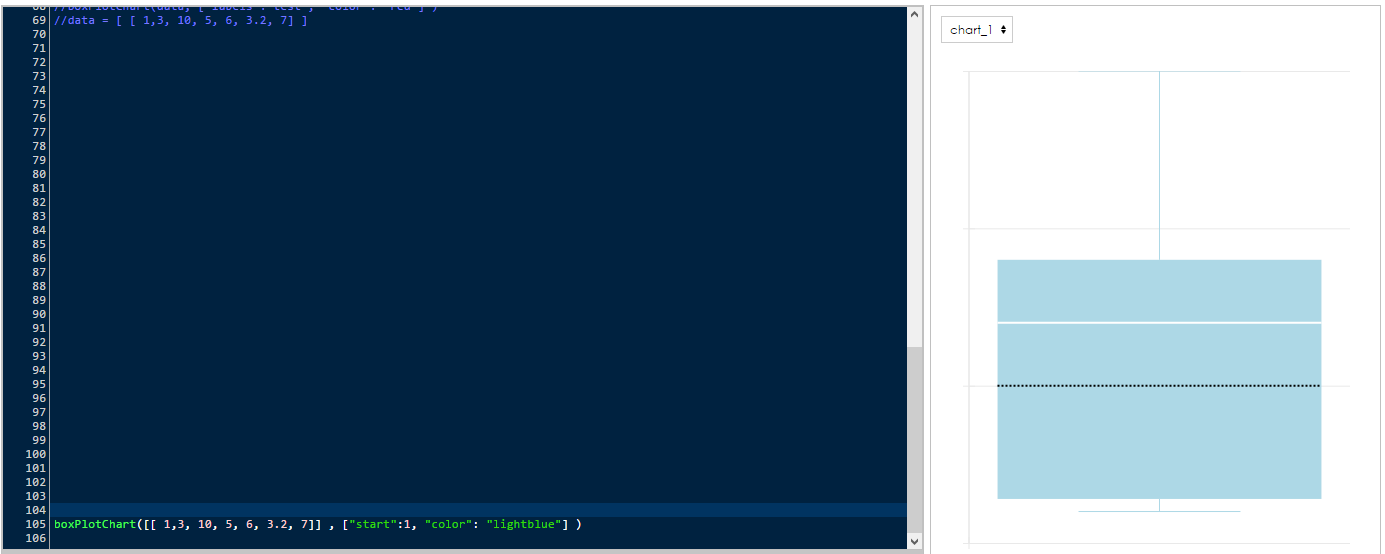
Displaying data in box plot chartAnother option is to display results in a form of a box plot chart. List of charts is displayed in control sidebar on left side of the screen in section Charts. The chart itself is displayed in the right sidebar. Function boxPlotChart is used for displaying the data as a box plot chart. The function is defined like this:
ParametersParameter data is mandatory, parameters id, params and columns are optional.
Sample usage
|
| Sv translation | ||||||||||||||||||||||||||||||||||||||||||||||||||||||||||||||||||||||||||||||||
|---|---|---|---|---|---|---|---|---|---|---|---|---|---|---|---|---|---|---|---|---|---|---|---|---|---|---|---|---|---|---|---|---|---|---|---|---|---|---|---|---|---|---|---|---|---|---|---|---|---|---|---|---|---|---|---|---|---|---|---|---|---|---|---|---|---|---|---|---|---|---|---|---|---|---|---|---|---|---|---|---|
| ||||||||||||||||||||||||||||||||||||||||||||||||||||||||||||||||||||||||||||||||
結果を確認できるように、プロジェクトからの結果が保存される必要があります。 BellaDati ML Studioには、永続的且つ一時的にデータを保存するさまざまな方法があります。 永続的にデータを保存するように、それらはデータセットに保存する必要があります。
一時保存には現行のセッションだけで使用可能です。テーブルや各種グラフは一時保存(一時出力)として使用することができます。それらのテーブルや各種グラフは各セッションの終了後に削除されます。 データセットへの永続データの保存データセットにデータを保存できるように、正しい構造(属性とインジケータ)を持つデータセットを既に作成しておく必要があります。 詳細については、データセットの作成を参照する。storeDatasetの関数の目的はデータを保存する為です。この関数は以下のように定義されます。
パラメータ全てのパラメータは必須です。
使用例
このコードは、最初に'temptable' の'一時テーブル'を作成し、ID 16のデータセットに保存します。テーブルの先頭コラムは、コードM_COLUMN_1のインジケータに一致されます。二番目コラムは、コードM_COLUMN_2のインジケータに一致されます。メソッドdelete_allが使用できるように、テーブルからデータを保存する前に対象データセットの既存の全データは削除されます。
このコードは、一つのコラムを持つ'temptable2'の一時テーブルを作成し、ID 17のデータセットに保存します。テーブルのコラムは、コードM_COLUMN_1のインジケータに一致されます。コード「M_COLUMN_2」で二番目コラムは、全ての列に10を詰めます。メソッドdelete_allが使用できるように、テーブルからデータを保存する前に対象データセットの既存の全データは削除されます。 データの一時保存一時保存対象データは以下の通りです。
テーブルへのデータの保存一時テーブルは列及びコラムを持つフォームに結果を表示するのに用いられます。テーブルのリストは、セクションテーブルの画面の左側のコントロールサイドバーに表示されます。テーブル自体は右側のサイドバーに表示されます。また、CSVファイルとしてダウンロードすることもできます。
tableの関数の目的はテーブルへデータを保存する為です。この関数は以下のように定義されます。
To be able to see the results and work with them, the results from a project needs to be stored. There are different ways of storing data in BellaDati ML Studio - permanently and temporarily. For storing the data permanently, they need to be stored in data set. Temporary storage is available only for current session. Tables and various charts can be used as temporary storage (temporary output). These tables and charts are deleted after end of each session. Storing data Permanently in Data SetTo be able to store data in data set, the data set with correct structure (attribute and indicators) needs to be already created. See Creating Data Set for more information. Function storeDataset is used for storing the data. The function is defined like this:
ParametersAll parameters are mandatory.
Sample usage
This code will first create a temporary table 'temptable' and then store in data set with ID 16. First column of the table is mapped to indicator with code M_COLUMN_1, second column is mapped to indicator with code M_COLUMN_2. Method delete_all is used and therefore all existing data in the target data set will be deleted before storing data from the table.
This code will first create a temporary table 'temptable2' with one column and then store in data set with ID 17. The column of the table is mapped to indicator with code M_COLUMN_1. Second column with code M_COLUMN_2 will be filled with number 10 (all rows). Method delete_all is used and therefore all existing data in the target data set will be deleted before storing data from the table. Storing Data TemporarilyData can temporarily stored (displayed) as:
Storing data in tableTemporary table can be used for displaying results in a form of rows and columns. List of tables is displayed in control sidebar on left side of the screen in section Tables. The table itself is displayed in the right sidebar. It is also available to download it as a CSV file.
Function table is used for storing the data in table. The function is defined like this:
ParametersParameter data is mandatory, parameters id and columns are optional.
Sample usage
This code will create two tables with the same content. The first table has defined its name and names of both columns. Second table does not have its name defined and therefore it will be named as table_2. It also has defined name only for the first column. The second will be named automatically as 1.
Displaying data in bar chartIt is possible to display results in a form of a bar chart. List of charts is displayed in control sidebar on left side of the screen in section Charts. The chart itself is displayed in the right sidebar.
Function barChart is used for displaying the data as a bar chart. The function is defined like this:
パラメータParameter data is mandatory, parameters id, params and columns are optional.
Sample usage
This code will create a bar chart with the name "bar chart", with five columns, cyan color and label "Results" on X axis.
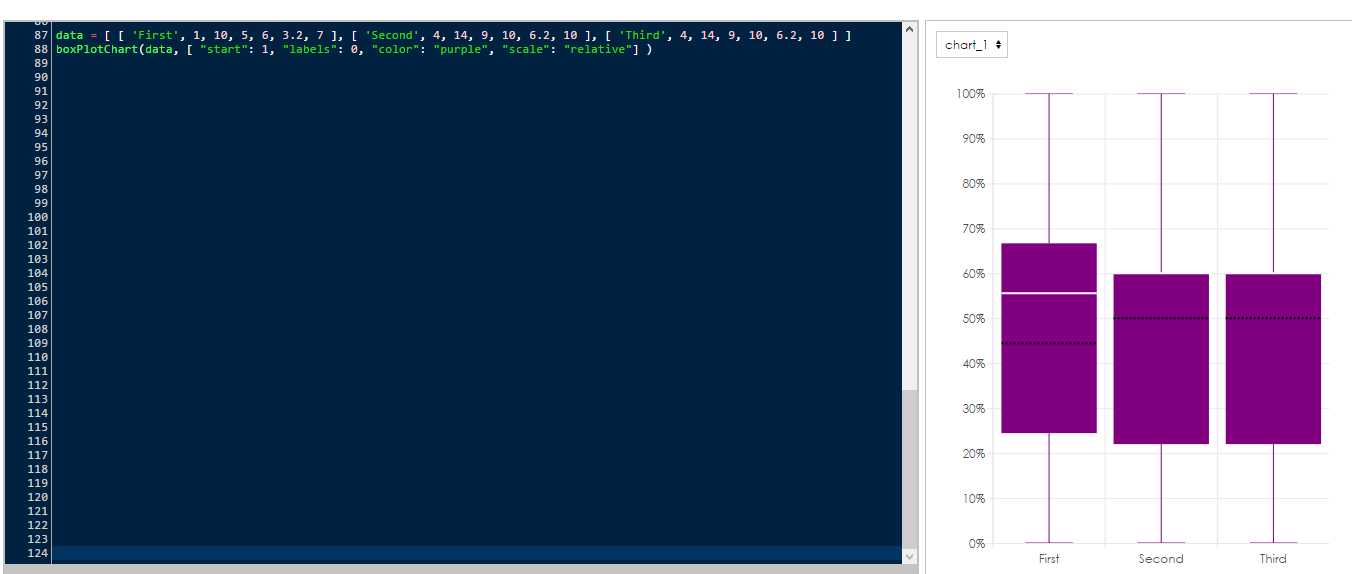
Displaying data in box plot chartAnother option is to display results in a form of a box plot chart. List of charts is displayed in control sidebar on left side of the screen in section Charts. The chart itself is displayed in the right sidebar. Function boxPlotChart is used for displaying the data as a box plot chart. The function is defined like this:パラメータ「data」は必須ですが、パラメータ「id」及び「columns」は任意です。
使用例
このコードは同一な中身で二つのテーブルを作成することができます。 第一テーブルは自体のテーブル名と二つのコラム名を定義します。第二テーブルの名称がまだ定義されていないので、第二テーブルの名称に「table_2」を付与します。その名称は一コラム目に定義されます。 二コラム目の名称は自動的に1を付加されます。
バーグラフのデータ表示バーグラフの形式で結果も表示することができます。グラフリストは、画面のセクションの左側のコントロールサイドバーに表示されます。グラフ自体は右側のサイドバーに表示されます。
barChartの関数の目的はバーグラフとしてデータを表示する為です。この関数は以下のように定義されます。
パラメータパラメータ「data」は必須ですが、パラメータ「id」、「params」及び「columns」は任意です。
使用例
ParametersParameter data is mandatory, parameters id, params and columns are optional.
このコードは横軸上にシアンの色、「結果」ラベルで5コラムを含むバーグラフを作成します。
箱ひげ図でのデータ表示箱ひげ図の形式で結果も表示することができます。グラフリストは、画面のセクションの左側のコントロールサイドバーに表示されます。グラフ自体は右側のサイドバーに表示されます。 boxPlotChart の関数の目的は箱ひげ図としてデータを表示する為です。 この関数は以下のように定義されます。
パラメータパラメータ「data」は必須ですが、パラメータ「id」、「 params」、「columns」は任意です。
使用例Sample usage
|
Overview
Content Tools