Page History
...
- id - defines the id (name) of the chart
- data - defines the content of the chart. Six values need to be defined, in this order:
min
max
avg
median
first quartile
third quartile.
- params - defines additional parameters of the chart, such as color, start etc.
- start - defines which number (column) should be used as first value (starting from 0). Example: there are 7 values defined, the user does not want to use the first value -> "start":1.
- color - defines color of the chart.
- labels - defines which column contains labels
- scale - defines scaling of the chart
- possible values: "relative"
- columns - defines the legend on X axis.
...
| Code Block | ||
|---|---|---|
| ||
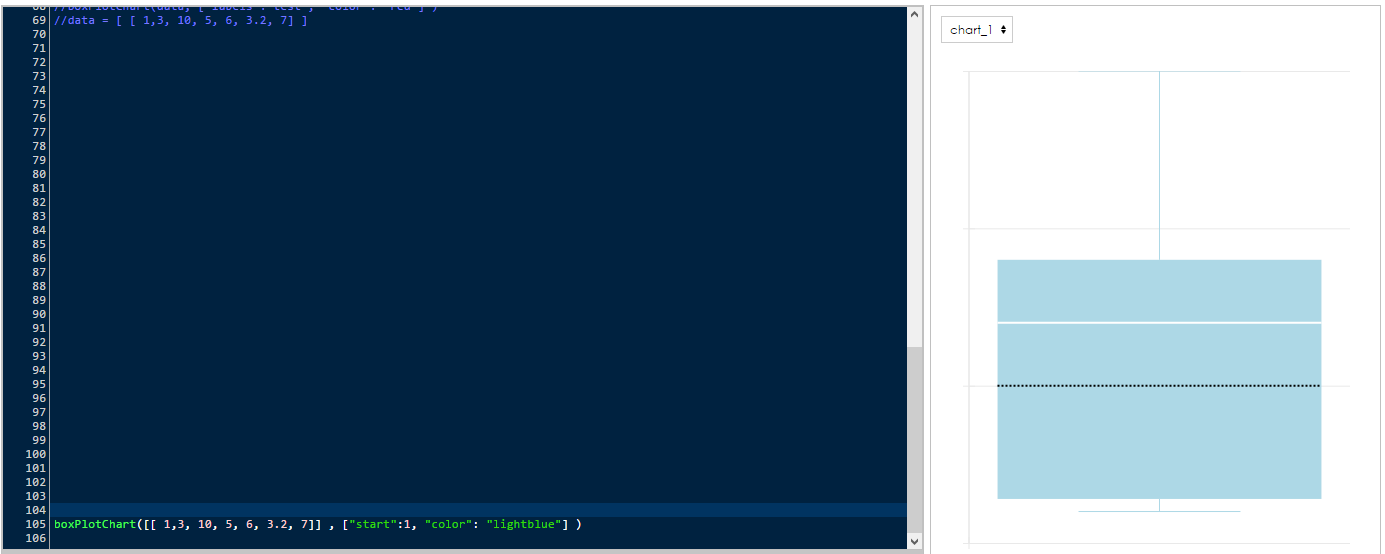
boxPlotChart([[ 1,3, 10, 5, 6, 3.2, 7]] , ["start":1, "color": "lightblue"] ) |
| Code Block | ||
|---|---|---|
| ||
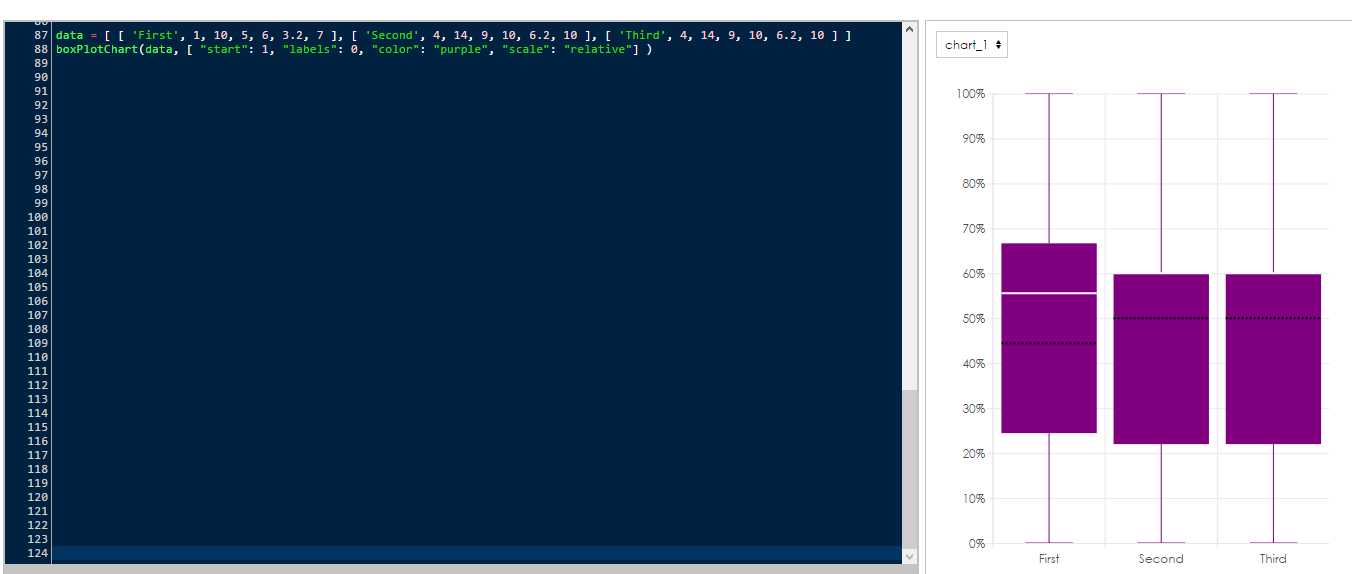
data = [ [ 'First', 1, 10, 5, 6, 3.2, 7 ], [ 'Second', 4, 14, 9, 10, 6.2, 10 ], [ 'Third', 4, 14, 9, 10, 6.2, 10 ] ] boxPlotChart(data, [ "start": 1, "labels": 0, "color": "purple", "scale": "relative"] ) |
data = [ [ 'First', 1, 10, 5, 6, 3.2, 7 ], [ 'Second', 4, 14, 9, 10, 6.2, 10 ], [ 'Third', 4, 14, 9, 10, 6.2, 10 ] ]boxPlotChart(data, [ "start": 1, "labels": 0, "color": "purple", "scale": "relative"] )
Overview
Content Tools