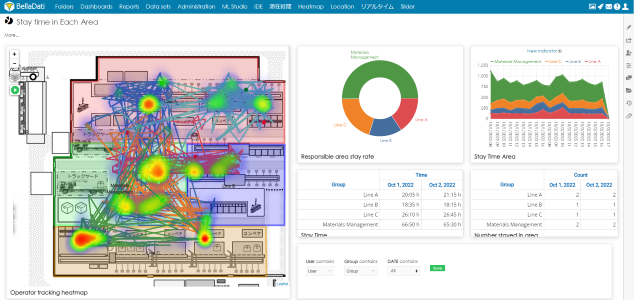
Heatmap & Tracking allow you to display picture with your floor plan, track movements of an object, and provide heatmap. | Info |
|---|
| You need to be in edit mode in order to create new tables. Click on "Edit" in top report menu to activate edit mode. |
To add a new Heatmap & Tracking, hover over free place and click on Floor plan view type and select Heatmap & Tracking. The Add Heatmap & Tracking dialog box will appear. - Enter name of the new Heatmap & Tracking label.
- Select you Background data definition. See here how to set it up
Confirm new H&T view by clicking on green Continue button. BellaDati will guide you through additional setup.
Drill-down and Pinpoint properties- Background data definition - you need to select a background image, where your data will be placed. This is defined in GEO locations.
- Regions - places GEO fences overlays. This needs to be defined in GEO locations. If Region is not set, PINs will appear.
- Show heatmap - you can define action to open popup window with specific report.
- Point radius - defines how big heatmap point should be
- Show movement lines- enables you to draw lines in time of item move
- Drill down by - select the attribute of the item drill down. Drill down value will be displayed in PINs
- Datetime - select an attribute where datetime of movement is stored
- Animate interval - enables drawing lines in time
- Steps per segment - allows you to slow down the animation
- Locations - Select an attribute where the location in a pattern like x,y as integer number (example 100,200) is stored
|