Overview
BellaDati Analytics framework is the framework and out-of-the box platform for IoT and analytics solution providers.It allows you to finish your projects faster while you can focus on solution.
- data cleaning and ETL
- BIG DATA data warehouse
- deep analytics (Machine Learning and Statistics)
- easy to use AGILE BI
- SDK, APIs framework (GUI and coding combination)
- IoT unification platform
- GEO and other data visualizations
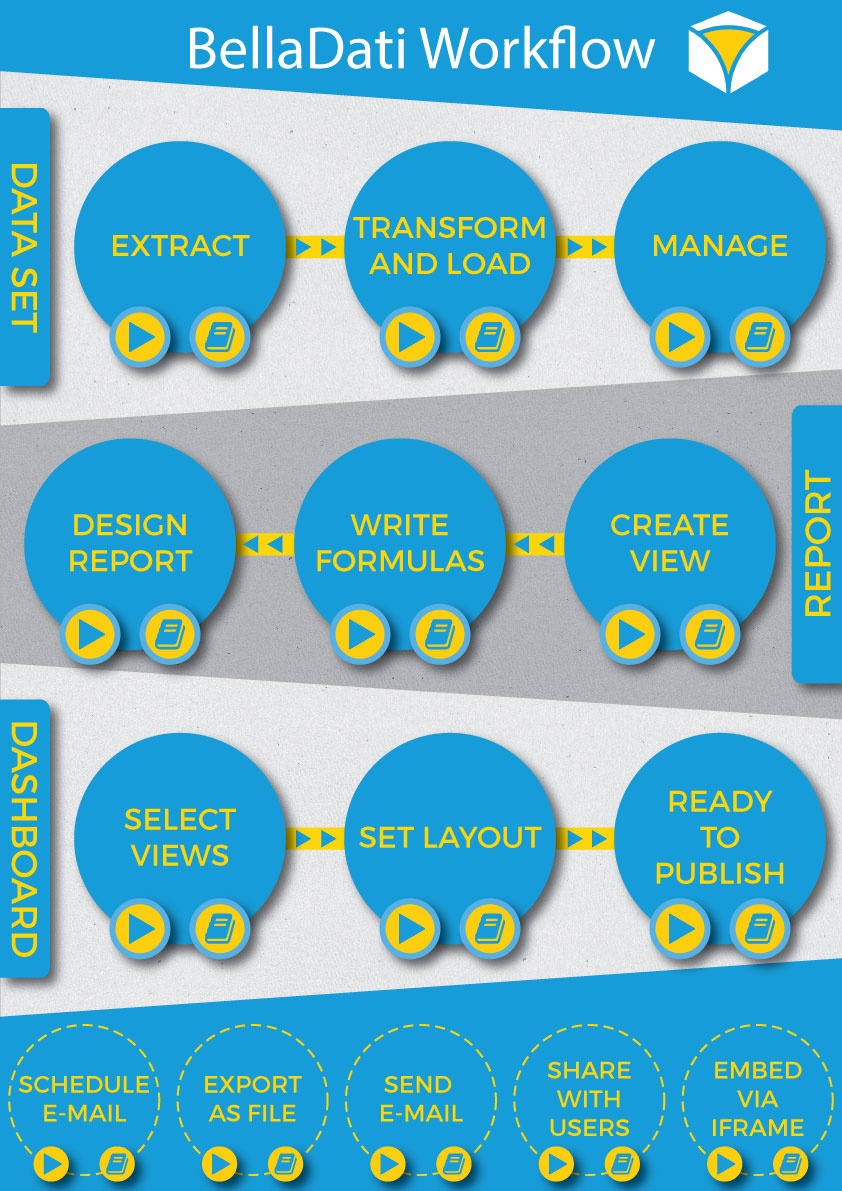
Belladati workflow (ONLY AGILE BI part)
The process of creating reports and dashboard is very simple and can be described with a very straightforward workflow. You can click on the video icon ![]() or documentation icon
or documentation icon ![]() to get more information about specific step.
to get more information about specific step.
 <map><area shape="circle" coords="141,338,31" alt="How to import data" href="https://youtu.be/O4KU-bGtrt0" target="_self"/> <area shape="circle" coords="221,337,28" alt="Importing data" href="http://support.belladati.com/doc/Importing+Data" /> <area shape="circle" coords="409,337,31" alt="Working with Data sets and Datasources" href="https://youtu.be/JBhhUg-6eYg" /> <area shape="circle" coords="492,339,30" alt="Import Settings" href="http://support.belladati.com/doc/Import+Settings" /> <area shape="circle" coords="679,336,31" alt="Working with data set" href="https://youtu.be/-CFhx-if1lM" /> <area shape="circle" coords="759,338,30" alt="Managing Indicators" href="http://support.belladati.com/doc/Managing+Indicators" /> <area shape="circle" coords="89,636,30" alt="Using report" href="https://youtu.be/PF7NVfAqcVg?list=PL48CzuF9XMMdAzwmI1V9aEVJJnPEvaZrw" /> <area shape="circle" coords="170,635,29" alt="Report appearance" href="http://support.belladati.com/doc/Report+appearance" /> <area shape="circle" coords="362,635,32" alt="Using report" href="https://www.youtube.com/watch?v=ckfrWGla2DY" /> <area shape="circle" coords="441,635,31" alt="Using formulas" href="http://support.belladati.com/doc/Using+Formulas" /> <area shape="circle" coords="631,637,32" alt="Working with the report" href="https://youtu.be/ckfrWGla2DY" /> <area shape="circle" coords="711,634,31" alt="Creating view" href="http://support.belladati.com/doc/Creating+View" /> <area shape="circle" coords="141,928,31" alt="How to use Dashboard" href="https://youtu.be/WFuK66reRVo" /> <area shape="circle" coords="222,931,31" alt="Creating Dashlet" href="http://support.belladati.com/doc/Creating+Dashlet" /> <area shape="circle" coords="410,930,30" alt="How to use Dashboard" href="https://youtu.be/WFuK66reRVo" /> <area shape="circle" coords="492,930,31" alt="Managing Dashboard Layout" href="http://support.belladati.com/doc/Managing+Dashboard+Layout" /> <area shape="circle" coords="681,929,30" alt="Public dashboard" href="https://youtu.be/fkbqBAONR4M" /> <area shape="circle" coords="761,931,30" alt="Sharing dashboard" href="http://support.belladati.com/doc/Sharing+Dashboard" /> <area shape="circle" coords="52,1165,17" alt="Schedule an e-mail" href="https://www.youtube.com/watch?v=U4PmccBi8j8" /> <area shape="circle" coords="120,1164,18" alt="Schedule an e-mail" href="http://support.belladati.com/doc/Export+schedule" /> <area shape="circle" coords="221,1165,17" alt="Export into external formats" href="https://www.youtube.com/watch?v=ZSbaaZD84p4" /> <area shape="circle" coords="285,1163,17" alt="Exporting Report" href="http://support.belladati.com/doc/Exporting+Report" /> <area shape="circle" coords="389,1165,17" alt="Send as e-mail" href="https://www.youtube.com/watch?v=U4PmccBi8j8" /> <area shape="circle" coords="454,1164,17" alt="Exporting report" href="http://support.belladati.com/doc/Exporting+Report" /> <area shape="circle" coords="558,1165,19" alt="Share with users" href="https://youtu.be/45LmG3pDyA4" /> <area shape="circle" coords="622,1164,18" alt="Sharing report" href="http://support.belladati.com/doc/Sharing+Report" /> <area shape="circle" coords="726,1165,17" alt="Embed using iFrame" href="https://youtu.be/8nOj0i01OIA" /> <area shape="circle" coords="790,1164,19" alt="Exporting View" href="http://support.belladati.com/doc/Exporting+View" /> <area shape="rect" coords="2,110,50,385" alt="Data Sets" href="http://support.belladati.com/doc/Data+Sets" /> <area shape="rect" coords="793,404,839,684" alt="Reports" href="http://support.belladati.com/doc/Reports" /> <area shape="rect" coords="1,700,49,978" alt="Dashboard" href="http://support.belladati.com/doc/Dashboards" /></map>
basic concepts
Key concepts used in BellaDati are described below. See BellaDati glossary for details.
Data set
BellaDati has its own integrated data warehouse. This warehouse contains virtual databases that represents data with similar characteristics. These virtual databases are called data sets and reports are build on them. Each data set can be connected to multiple data sources.
Possible actions: Importing data | Browsing data | Exporting data | Structure backup | Joining data sets | Watching data changes | Cleaning data | Sharing data | Defining attributes | Defining indicators | Creating and removing datasets
Data source
Imagine companies has already running their business. Such company has applications and systems installed or use services that generate a lot of data in underlying databases. Moreover employees produces Excel spreadsheets, text or CSV files of data. These databases and files are very suitable data sources for BellaDati analysis. Generally BellaDati can import data from all third party systems which are called data sources.
Possible actions: Connecting to database | Connecting over HTTP | Connecting to FaceBook | Connecting to Google Services | Connecting to CRM | Scheduling automatic upload
Report
Report is basically a set of tables and charts created mainly for detailed overview and analytical purposes on data stored in data sets. Each report can also contain custom content, comments, attachments and can be easily shared with other BellaDati users or published to corporate intranet or public. Permanent export of each report to PDF, Excel, PNG or Power Point is possible.
Possible actions: Creating report | Managing Layout | Creating view | Creating table | Creating chart | Creating geo map | Creating KPI label | Copying report | Sharing report | Exporting report | Adding comments | Publishing report | Filtering data | Using Formulas and scripts | Searching and Filtering Reports
Dashboard
Dashboard typically consists of the most important tables or charts from reports and is primarily determined for managers who need quick overview of actual company situation. Each dashboard can be customized by adding special content (dashlets). Dashboards can be also shared for public via web.
Possible actions: Creating dashboard | Managing Layout | Creating Dashlet | Sharing Dashboard | Adding Attachment
Additional information
Before you start working with BellaDati, we suggest that you first check these links:
Overview
Content Tools