No Translation available yet
You have Slovak selected as language but this page has not been translated yet. Translate the page or view the content in the default space language below.
Display default
How to start
Activate Development console in your favourite web-browser using the following steps.
- Chrome Windows and Linux (Shift + Ctrl + J)
- Chrome Mac OS (Option + Command + J)
- Firefox Windows and Linux (Shift + Ctrl + K)
- Firefox Mac OS (Option + Command + K)
- Internet Explorer Windows (F12 or Fn + F12)
- Safari Mac OS ( Enable Develop option by following steps - Command + comma, than click Advanced, than select Show Develop in menu bar,close window an use keys Option + Command + C)
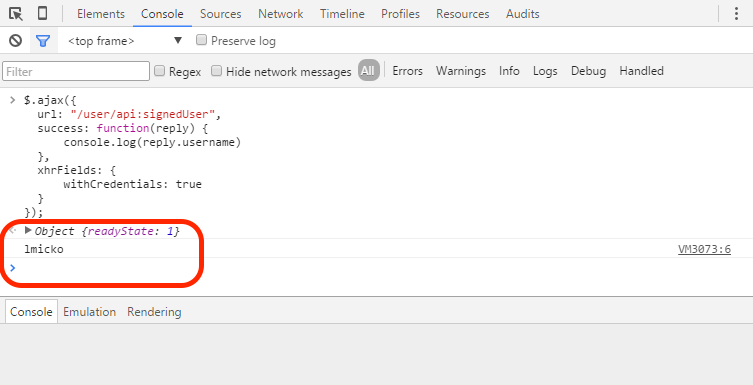
Example - Getting signed user
Log-in into BellaDati. Into the activated development console write following script:
$.ajax({
  url: "https://service.belladati.com/user/api:signedUser",
  success: function(reply) {
      console.log(reply.username)
  },
  xhrFields: {
      withCredentials: true
  }
});
As a result, the current user's username will be displayed in the console.
How to get API call overview from BellaDati GUI
The API call overview can be displayed directly in BellaDati GUI. This option is displayed only for users who have enabled the developer mode. Developer mode can be enabled in the user profile.
After the developer mode is enabled, API call icon will be displayed for all related components:
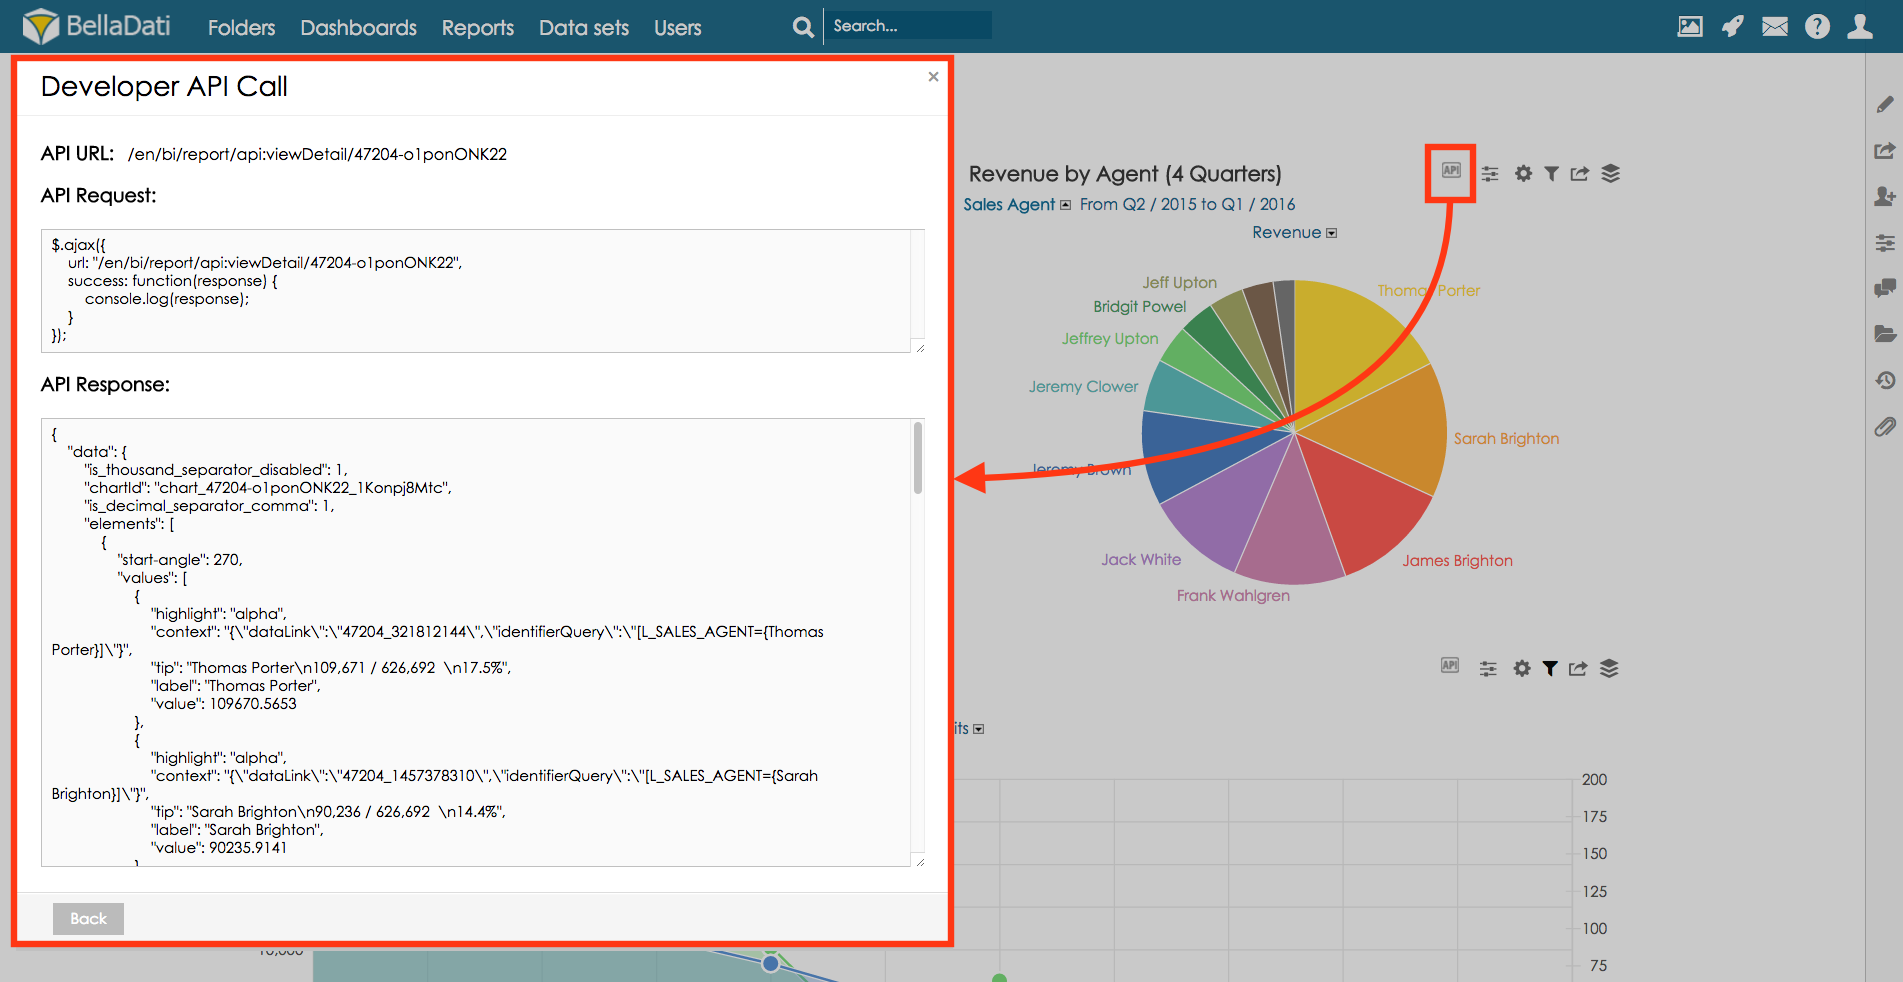
API call overview is displayed in:
1. Report detail -> for each type of the view (chart, table, KPI label, geo map, custom content view)
2. Search/Reports page -> for each report, user, dataset
3. Data set detail -> Data collecting forms -> for each form
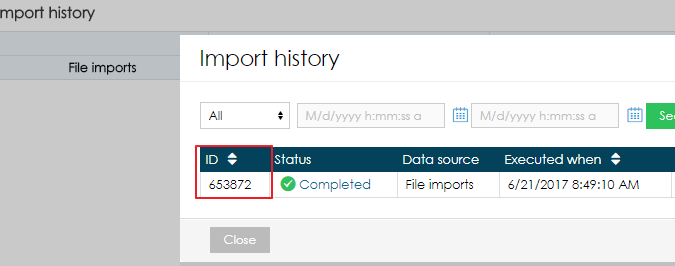
In import history, the ID of each import execution is displayed.