Anzeigen von Indikatoren [Original Seitentitel]| Note |
|---|
Diese Option bezieht sich auf Ansichten. Beziehen Sie sich immer auf Ansichten oder Sichttypen von Partikeln (Tabelle , Diagramm, Geo-Map or KPI Label), bevor Sie mit diesem Abschnitt fortfahren. |
Indikatoren stellen Werte dar, die in der erstellten Ansicht angezeigt werden. Sie können Indikatoren im Dialogfeld Indikatoren zur Ansicht hinzufügen. Das Dialogfeld "Indikatoren" ist in drei Spalten unterteilt: Liste der verfügbaren Indikatoren Liste der in der Ansicht angezeigten Indikatoren Zusätzliche Angaben zum Indikator
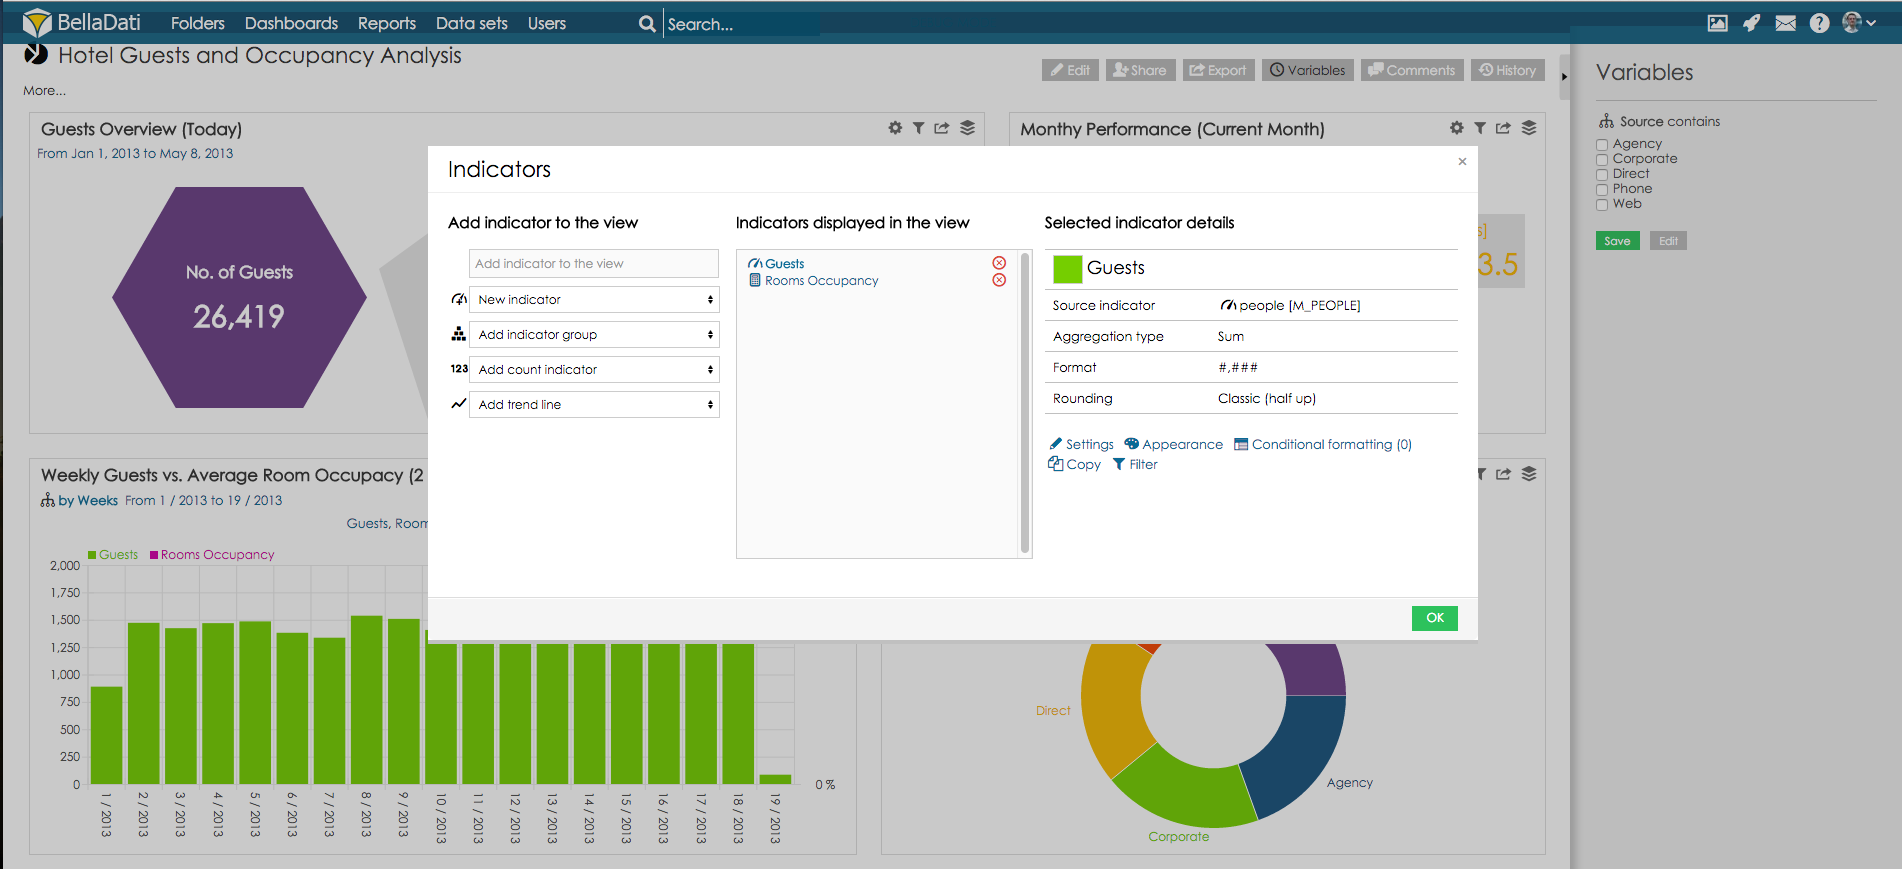 Image Added Image Added
Indikatoren hinzufügenEs gibt zwei Möglichkeiten, der Ansicht Indikatoren hinzuzufügen: - Aus vorhandenen hinzufügen: Klicken Sie in der Liste der verfügbaren Indikatoren auf den gewünschten Indikator. Der Indikator wird in den Bereich Angezeigte Indikatoren verschoben.
- Neu erstellen: Geben Sie den Namen des neuen Indikators in das Eingabefeld für neue Indikatoren des Abschnitts Angezeigte Indikatoren ein und klicken Sie auf das grüne Pluszeichen. Um mehr über das Erstellen neuer Indikatoren zu erfahren, folgen Sie den Anweisungen unterVerwenden von Formeln und Skripts.
| Info |
|---|
Sie können angezeigte Indikatoren entfernen, indem Sie auf das rote Kreuz klicken. |
Details zum IndikatorDie Details der Indikatoren sind in der rechten Spalte zugänglich, nachdem Sie die angezeigte Anzeige im Abschnitt Angezeigte Indikatoren ausgewählt haben. Zu den Details der Indikatoren gehören: You can perform following tasks to edit displayed indicator: - Edit Indicator setting
- Edit Appearance settings
- Create Conditional formatting
- Duplicate indicator
Edit indicator settingClick Indicator setting to enter edit dialog. From the Indicator setting dialog you can edit: - Name of the indicator.
- Unit to be displayed with the indicator.
- Format of the indicator data. Click show help to expand format syntax hints.
- Rounding of decimal values.
- Select Classic (half-up) option to apply traditional rounding function.
- Select Always up to automatically round data to the higher values.
- Select Always down to automatically round data to the lower values.
- Members aggregation to define how aggregated values should be processed. Click show help to expand members aggregation hints.
- Select Sum to display total value of indicator records.
- Select Average to display average value of indicator records.
- Select Number of records to display count of indicator records.
- Select Minimum to display minimal value from indicator records.
- Select Maximum to display maximal value from indicator records.
- Empty values processing. Select checkbox to edit custom value for emtpy values replacement.
- Show as URL link. Define URL link to create drill-through.
- Numeric transformation. Choose value from combobox to select how the value should be transformed (show percent, thousandth, ten thousandth, millionth, ten millionth, hundred millionth or billionth).
Image Added
Edit appereance settingsClick Appereance settings to enter edit dialog. From the Appereance settings dialog you can edit: - Font color. Click basic color icon to expand the pallet of predefined font and background colors.
- Font style. Select Bold checkbox to make the indicator values appear in bold.
| Info |
|---|
Select Default from basic color pallet to reset the font color. |
You can also edit indicator color directly from indicator detail. Click on the box next to the indicator name and choose color.
| Anchor |
|---|
| conditional-formatting |
|---|
| conditional-formatting |
|---|
|
Click Conditional formatting to enter edit dialog. There are two options for creating conditional formatting. Apply preset conditional formatting styles. - Select Black and red numbers to apply discrete formatting based on provided Treshold values.
- Select Growth and decay to apply continuous formatting based on indicator values.
- Select No conditional formatting to reset any defined styles.
Create own conditions and define styles. Click Create condition link to expand condition options. - Select font color and background to be applied to conforming indicator values from predefined palett.
- Select symbol to be append to conforming indicator values.
- Select condition to evaluate indicator values. BellaDati offers following conditions:
- greater than
- lower than
- greater by
- lower by
- greater by (%)
- lower by (%)
- Insert value related to condition or select previous value as source for evaluating the condition.
- Select Show growth/decrease in % checkbox to enrich indicator values with relative changes.
- Condition can be also defined by formula. Click on dropdown indicator and choose value formula. Conditional formatting will be applied when this formula returns true.
Click Add button to confirm create conditional formatting. You can add multiple conditions by repeating the procedure. 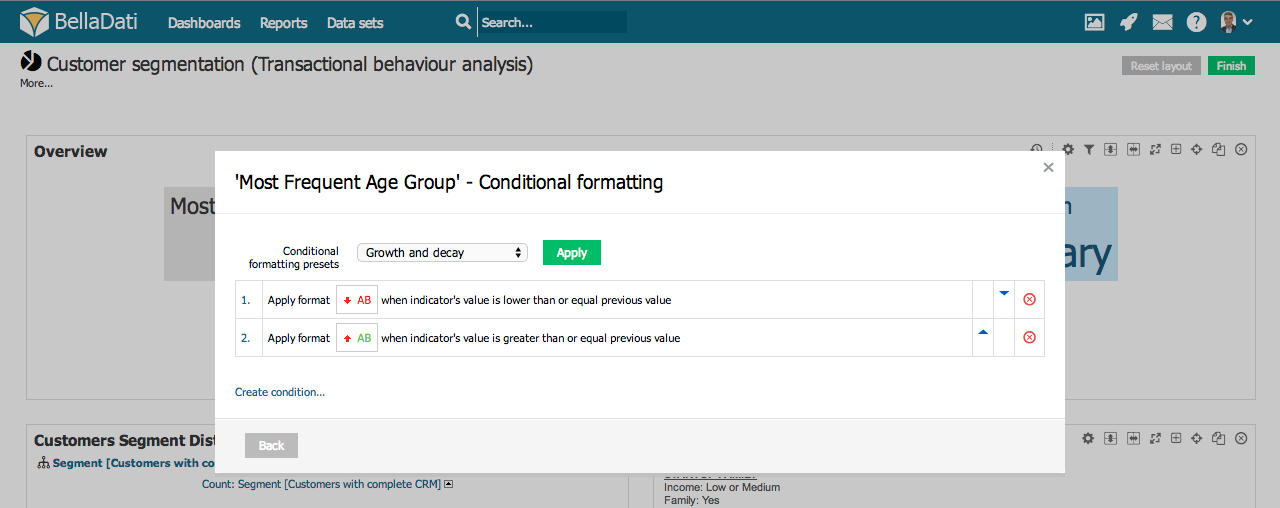 Image Added Image Added
| Info |
|---|
You can remove conditional formatting by clicking on the red cross sign. |
Next Steps | Related content |
|---|
| | Wiki Markup |
|---|
{related:NumLabels=6} |
|
|