Versions Compared

Key

  • This line was added.
  • This line was removed.
  • Formatting was changed.
Sv translation
languageen

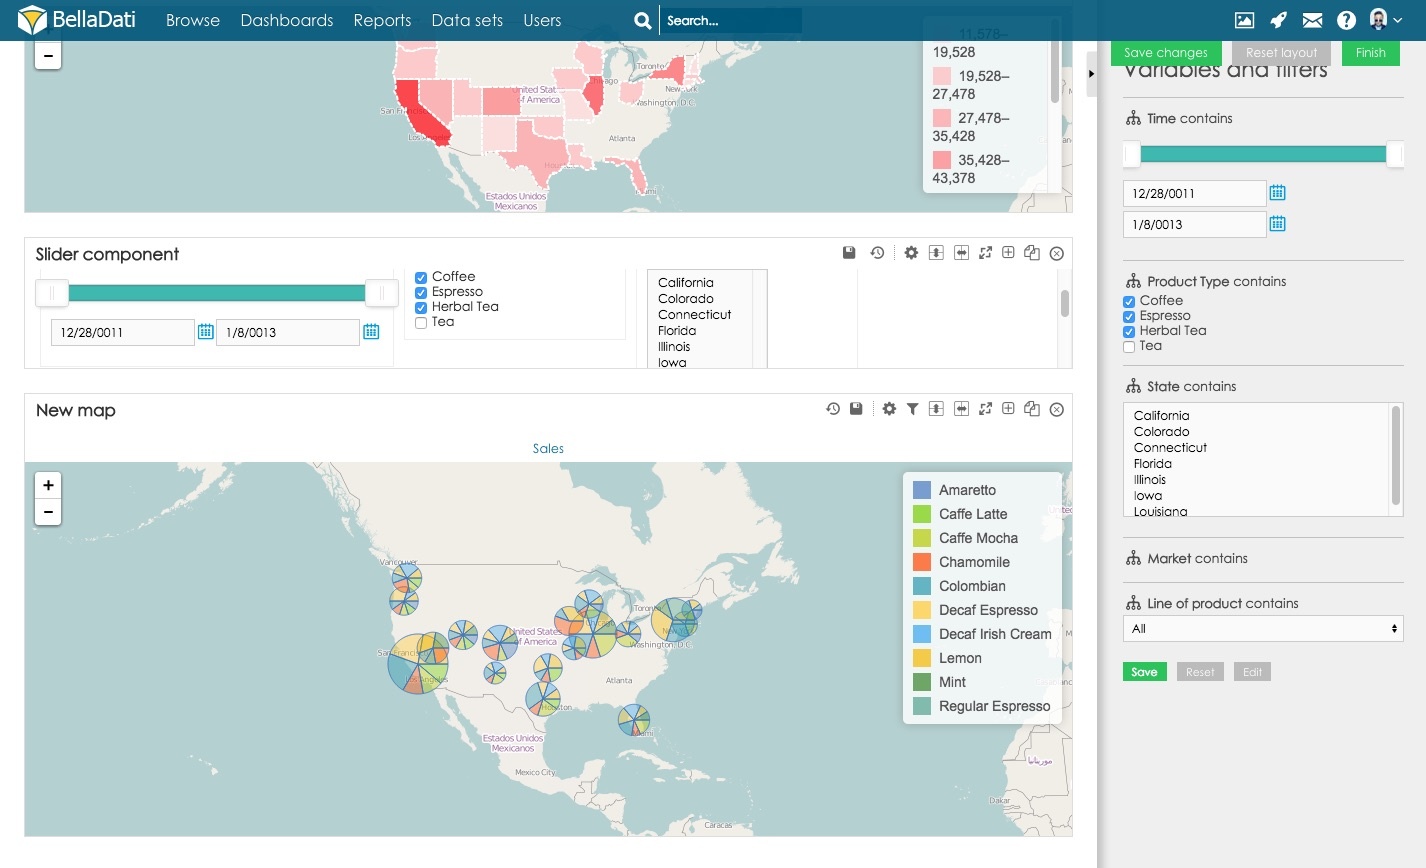
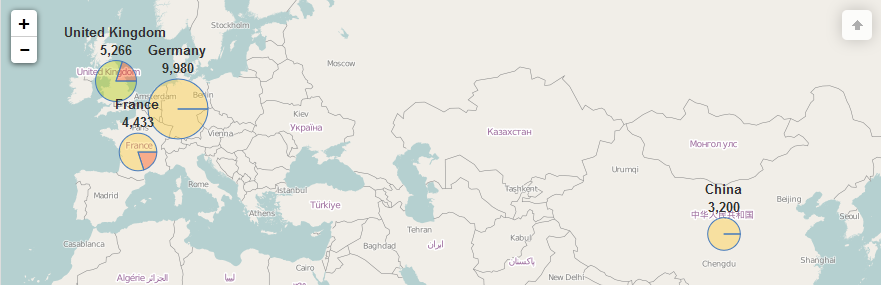
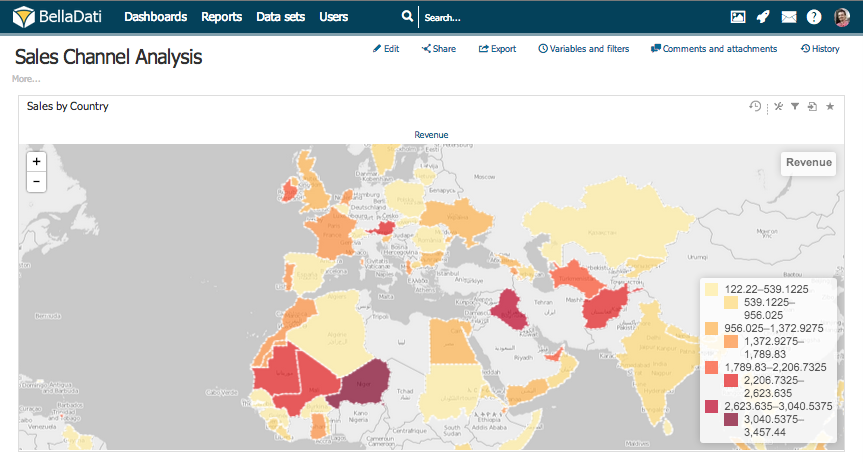
Geo maps allow you to visualize Indicators on the interactive maps.

Note

You need to be in edit mode in order to create new Geo map. Click on "Edit" in top report menu to activate edit mode.


Info

Map Charts Geo Data needs to be defined prior to creating new Maps. Or the Data Set has to include GEO Point attribute or GeoJSON attribute.

To add a new Geo map, hover over Insert new row and click on Map view type. New Map dialog will appear.
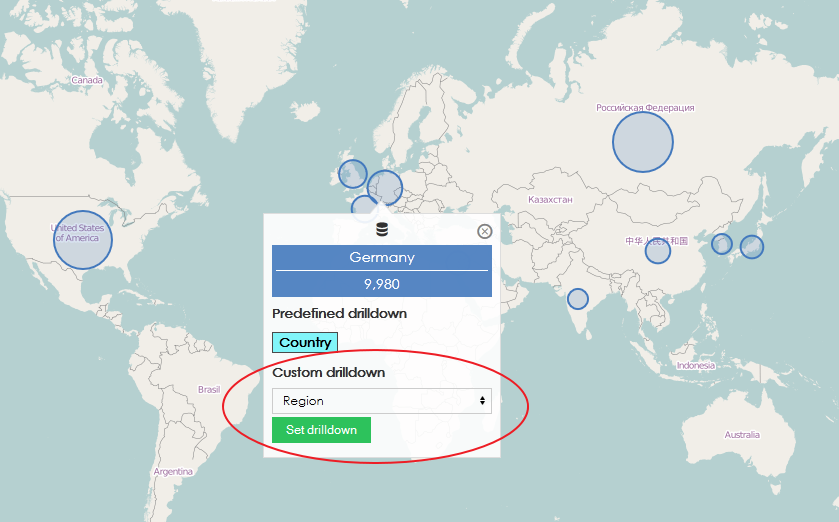
  1. Enter the name of the New map and select Indicators that should be displayed in the map
  2. You have to add Drill down to complete the view setup. Drill down defines which attribute will be used to categorise and position data on the map (for instance Sales indicator for specific State)
  3. You can select Show details for. This option will do drill-down for selected Indicator according the attributes (for instance Sales Indicator for specific State and specific Coffee Product)
  4. You can enable "Show values" to display indicator values on map.
Tip

Example: The most common drill downs associated with Geo maps include Country, Region or City. When Country attribute is selected:

  • Indicators are grouped according particular country.
  • Values are placed to proper position corresponding with country location.

Drill Down

You can specify drill down from Chart settings. To access dialog:

  1. click on add drill down to complete the view setup link in the created view.
  2. enter Map chart settings dialog from the toolbox and click Add drill down path.

Custom drill down

Anchor
custom-drill-down
custom-drill-down

As in chart and tables, you can set another drill down to change the granularity of map. To do so you have to specify default GEO location mapper in Attribute settings in Data Set.

If it is all set, you can click on any drill down member, select Custom drill down Attribute and click on Set drill down.

If Predefined drilldown (for example Country > City) is also set, it is possible to drill-down with left mouse click. Default pop-up window is then available with right click.

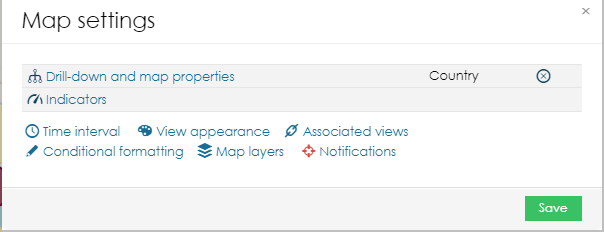
You can download video of setting custom drill down here

Map settings

Map settings dialog allows you to:

  • Specify Attribute or GEO Point to be used for aggregating and categorizing indicator's values.
  • Show details for monitored Indicator
  • Select Place definition for proper positioning and visualization of data.
  • Manage places definitions - continue by Managing GEO Data .
  • Select desired map provider.
  • Setup Limit for members in the drill down path. Displayed memebers depend on current sorting setup.
  • Specify Number of colors for shape-based map. By default, BellaDati will create scale with eight colors. Users can override this setting.
  • Show administrative boundaries
  • Show values
  • Show attribute value list. Allow you to display the additional information and the image related to the displayed member.
  • Using Member list settings you can define image and action on click to your attribute using formula and display additional description bellow Drilldown member. This only works for points in map.
    • Value title - Select from what column should title be obtained
    • Value description - Select from what column should description be obtained
    • If you enable Show attribute value image, Image formula field appears. There you can using formula define your image from media gallery. See example

      Code Block
       return '/bi/media:showimage/'+imageId;   


    • If Image formula will return an array, slideshow will be used on mouse hover every 2 seconds. See example

      Code Block
      return ['/bi/media:showimage/36','/bi/media:showimage/11','/bi/media:showimage/5','/bi/media:showimage/41']


    • If you enable Show actions formula, Actions formula field will appears. It must return a map with icon and link. See example

      Code Block
      return [[icon:'edit',link:'report:89?ID='+id]]


  • Display Marker instead of points.
  • Link values on the map with a line. Define the weight and color of the line. Or hide points on the line, which links the locations.
  • PINs link - you can define an action to open a popup window with a specific report.
    • Variable can be passed like this: viewreport:287-Ty9CWFdvmo?parameter1=@parameter1
    • Drilldown value can be passed like this: viewreport:287-Ty9CWFdvmo?parameter2=$attribute
  • Layers opacity (%) - Takes values from 1-100 to set opacity of layer fill. Border of layer will stay not changed.

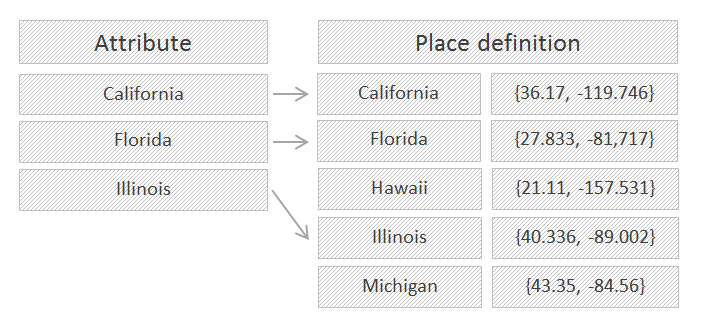
Associating Attribute with Place definition

There is a fragile connection between drill down and place definition. While drill down maintains indicator values and their categorization, place definition keeps pairs of location identification and its coordinates. BellaDati automatically connects attribute's members with places and therefore enables their proper positioning.

Note

You should always select only attributes which can be associated with an existing Place definition. In case of an attribute with no related Geo data, indicators will not be displayed appropriately.


Drill down option allows you to define:

  1. how displayed indicators will be grouped and categorized.
  2. what granularity will visualized data have.
  3. which mapping background will be used (Standard, Black & White, Gray Scale, Outdoors, Cyclo, etc.)


Place definition option is used to associate selected attribute with Geo data.

Select Place definition according to:

  1. Drill down path you selected.
  2. Style of visualization you want to apply (point vs. region).

Each Place definition includes pair on place identification and its coordinates.

Coordinates can be represented as:

  • Points. In point definition, location is identified by pair of values representing exact longitude and latitute.
  • Regions. In region definition, area is restricted with polygon, composed of set of longitude and latitude values.

For more information about Place definition continue by Managing GEO Data .

Using GEO Points


GEO point is a special attribute type holding latitude and longitude coordinates of a special location. GEO points are most convenient to use when location information are stored directly in imported Data Set. It automatically generated its own place definition and can be directly used in reports. 

To use geo points:

  1. Select GEO point attribute in Drill-down settings
  2. Find relevant Point definition
  3. Choose desired map provider

Map management

You can perform additional operations in upper right corner of the inserted Map view:
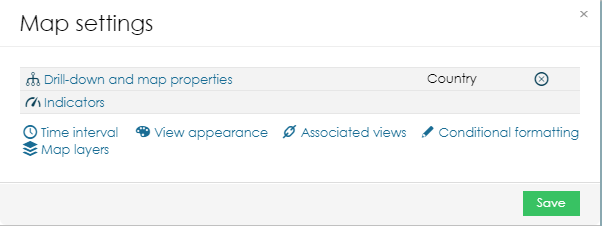
  • Table settings
  • Filter setting - continue by Static Filters.
  • Export view - continue by Exporting View
  • Add to dashboard
  • Move map
  • Duplicate map
  • Delete map


Map settings

Click on toolbox icon to enter Map settings dialog.

Map settings dialog shows Indicators and Drill down path currently applied to the map. BellaDati allows you to:
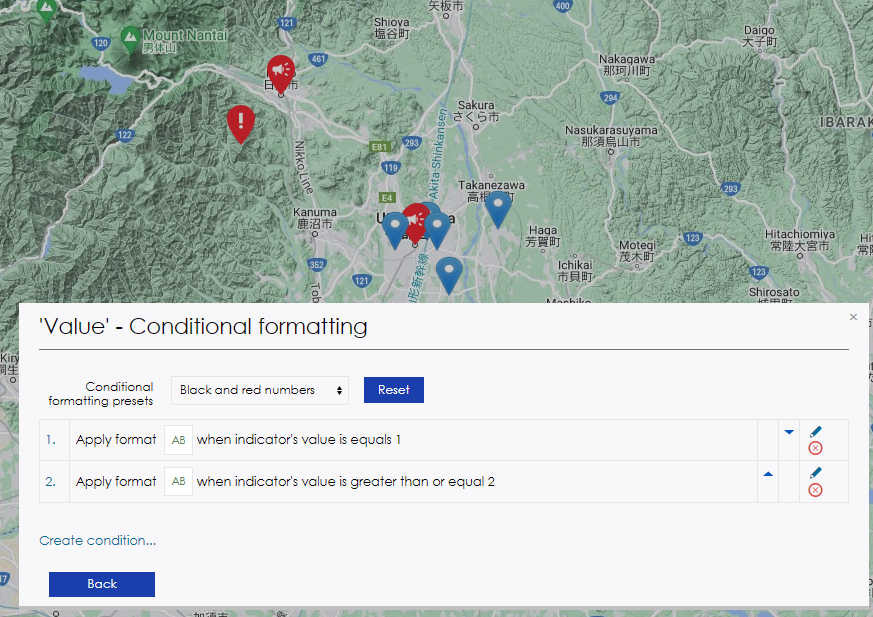
  • Enter indicators or drill down path dialogs.
  • Remove drill down path.
  • Add time axis - continue by Setting Date Interval .
  • Add conditional formatting - see next paragraph.


Conditional formatting

There are two types of conditional formatting available for maps.
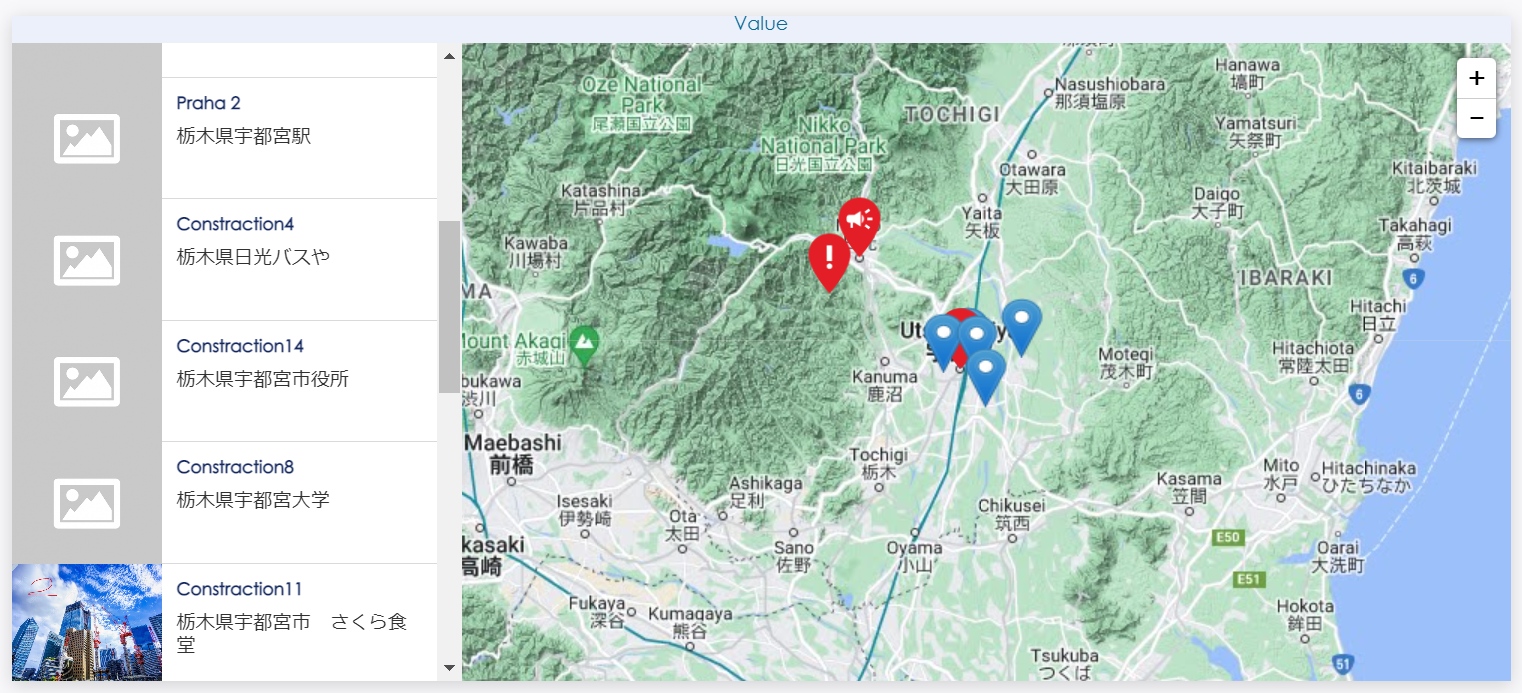
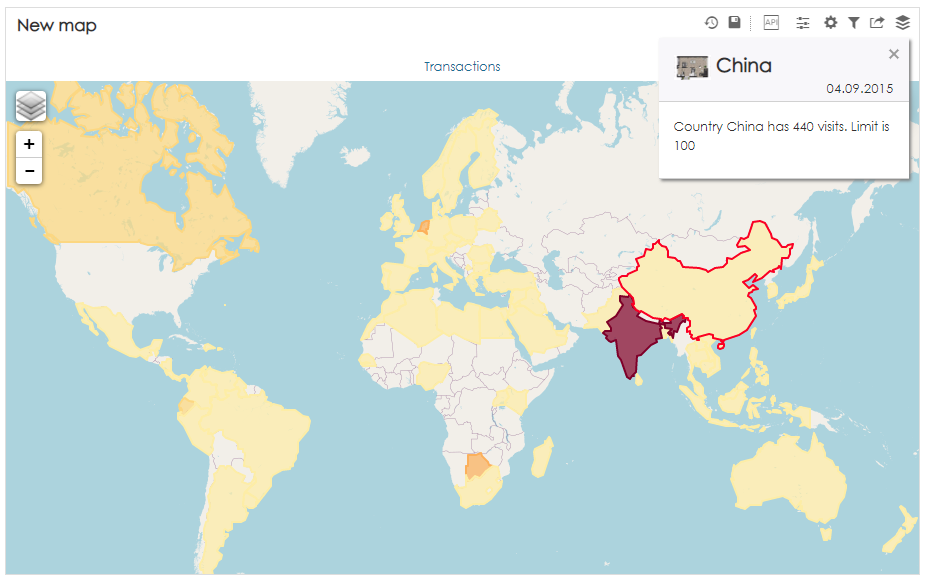
  • Conditional formatting for indicators - Displaying Indicators.
    • Background color applies to shapes and foreground color for points.
    • The displayed pin icon can be changed depending on the condition

  • Map conditional formatting - chosen color is applied to drill-down member whose value is smaller or equal than specified value. You can create your own color scheme by using multiple rules.

Displaying image in indicator details

If there is added image to the attribute member which is used in the map, this image will be also displayed in indicator details.
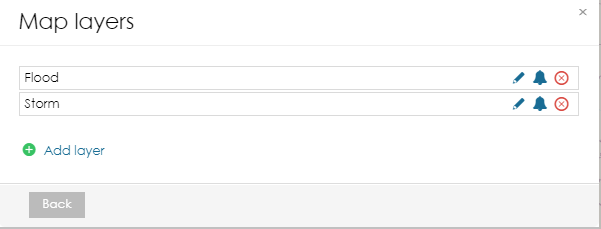
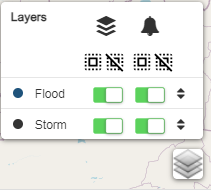
Info

Images can be managed in attribute members appearance.

Map layers

Allows you to set a set of new layer on top of all layers. Those layers can be turned on and off by button, color can be defined, and indicator value is defined by formula. It has similar settings as shape maps. For each layer specific notification can be assigned. Using drag and drop, possition of layer can be changed.

In Map settings select Map layers


Map layer settings

  • Name - name of this specific layer
  • Basic color - this color will be used as a color of your layer.
  • Drill down by - here you specify your attribute to be used as drill down.
  • Places definition - Select Place definition for proper positioning and visualization of data. For more information about Place definition continue by Managing GEO Data .
  •   - Instead of selecting value for Places definition from column, you can define those definition using a formula. Formula must return one value, or array of values.
  • Icon - select icon, that will be used in right bottom corner to enable or disable this layer
  • Formula - Instead of setting your indicator, define your value using formula
  • Enable mouseover - This will enable additional formula, that will override "Formula" and its visual. Only label will be displayed with returned value of formula
  • Enable label - This will enable additional formula, that will place text defined in formula over a place definition inside of map.
  • Canvas layer - This is special feature, that allows you to draw your special information inside of map

    Code Block
    //code example
    var context = canvas.getContext('2d')
    context.beginPath();
    context.arc(100, 75, 50, 0, 2 * Math.PI);
    context.stroke();


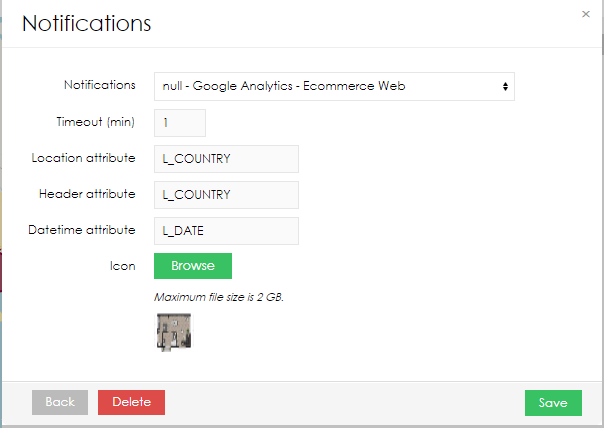
Notification settings

  • Notifications - List of all System notification that will trigger associated layer
  • Timeout - Validity of notification
  • Location attribute - If location is sent as part of notification and this attribute value is stored in source notification dataset, then it will be paired with place definition. If those conditions are met, place will be highlighted when hover over notification label with cursor. In this case, you will set attribute name of locations stored in source dataset, that handles notification.
  • Group by location attribute - Notifications can be grouped by the location attribute. In that case, notifications are compared whether they match except the location value and then show as one with locations as list highlighting all locations.
  • Available locations attribute/formula - You can specify, what places can be shown as notification. You can select attribute from dataset, or define using formula

    Code Block
    return ['Germany','Czech Republic']


  • Header attribute - Set name of attribute from notification dataset, that will define header of notification
  • Datetime attribute - Set name of attribute from notification dataset, that will place datetime and sort notifications accordingly.
  • Icon - It will place informative icon for specific notification.

Notifications

Allows you to display lists of multiple notifications according to set rule in Data set Notification. After mouse hover over notification, area can be highlighted.

  • Create your notification definition in Notifications. As notification action use "System notification"
  • In Map settings select Notifications
  • In Notifications select, you should be able to see and pick your System notification
  • Timeout indicates after what time closed notification will no longer appear, when page is loaded again.
  • Location attribute allows you to highlight area of specific notification on the map. In this case, every notification will highlight country of origin.
  • Header attribute shows title of each notification.
  • Datetime attribute if sets, display date and time. This is not time of notification sent, but time from dataset.
  • Icon, each notification can have the same icon next to the text

Linking points on the map

If you want to link the points in the map, select the option link values. In this case, the values are linked based on drill-down used in the map. The drill-down should contain the sequence of the points, e.g. timestamp of the visualized trip.

If you want to highlight the points on the map, select one of the markers (option display marker):

Video Tutorial


HTML
<iframe width="560" height="315" src="https://www.youtube.com/embed/krQU1dkiU_0" frameborder="0" allow="accelerometer; autoplay; encrypted-media; gyroscope; picture-in-picture" allowfullscreen></iframe>


...

Sv translation
languageja

Geoマップを使用すると、インタラクティブマップでインジケータを視覚化できます。

Note

新しいGeoマップを作成するには、編集モードにする必要があります。上部のレポートメニューで[編集]をクリックして、編集モードを有効にします。


Info

マップチャートGeoデータは、新しいマップを作成する前に定義する必要があります。または、データセットにGeoポイント属性もしくはGeoJSON属性を含める必要があります。

新しいGeoマップを追加するには、[新しい行を挿入]にカーソルを合わせ、[マップビューの種類]をクリックします。新しいマップダイアログが表示されます。

  1. 新しいマップの名前を入力し、マップに表示するインジケータを選択します。
  2. ビューのセットアップを完了するには、ドリルダウンを追加する必要があります。ドリルダウンは、マップ上のデータの分類と配置に使用する属性を定義します(例えば、特定の州の売上インジケータ)。
  3. [詳細を表示]を選択できます。このオプションは、属性に従って、選択したインジケータのドリルダウンを実行します(例えば、特定の州と特定のコーヒー製品の売上インジケータ)。
  4. 「値を表示」を有効にして、マップにインジケータ値を表示できます。
Tip

例: 地理マップに関連付けられている最も一般的なドリルダウンには、国、地域、都市が含まれます。国属性が選択されている場合:

  • インジケータは、特定の国別にグループ化されます。

  • 値は、国の場所に対応する適切な位置に配置されます。

ドリルダウン

チャート設定からドリルダウンを指定できます。ダイアログにアクセスするには:

  1. 作成されたビューで「ドリルダウンを追加してビュー設定を完了する」リンクをクリックします。
  2. ツールボックスからマップチャート設定ダイアログに入り、[ドリルダウンパスの追加]をクリックします。


カスタムドリルダウン

Anchor
custom-drill-down
custom-drill-down

グラフや表の場合と同様に、別のドリルダウンを設定して、マップの粒度を変更できます。そのためには、データセット属性設定デフォルトのGEOロケーションマッパーを指定する必要があります。

すべて設定されている場合は、任意のドリルダウンメンバーをクリックし、[カスタムドリルダウン属性]を選択して、[ドリルダウンの設定]をクリックします。

定義済みのドリルダウンも設定されている場合は(例: 国>都市など)、マウスの左クリックでドリルダウンできます。その後、右クリックでデフォルトのポップアップウィンドウを使用できます。

カスタムドリルダウンの設定に関するビデオは、こちらからダウンロードできます。

マップ設定 

マップ設定ダイアログでは次のことができます:

  • インジケータの値の集計と分類に使用する属性またはGEOポイントを指定。

  • モニターされるインジケータの詳細を表示

  • 適切な配置とデータの視覚化のための場所定義を選択。

  • 場所定義の管理 - Managing GEO Dataに進みます。

  • 目的のマッププロバイダーを選択。

  • ドリルダウンパスのメンバーの制限を設定。表示されるメンバーは、現在のソート設定に依存します。
    形状ベースマップの色数を指定。デフォルトでは、BellaDatiは8色のスケールを作成します。ユーザーはこの設定を上書きできます。

  • 行政の境界を表示します
  • を表示します
  • 属性値一覧を表示します - 表示されているメンバーに関連する追加情報を表示したり、画像を表示することができます。
  • メンバーリスト設定を使用すると、数式を使用して属性に画像とクリック時のアクションを定義し、ドリルダウンメンバーの下に追加の説明を表示することができます。これは、マップ内のポイントに対してのみ機能します。
    • 値のタイトル - どの列からタイトルを取得するかを選択します。
    • 値の説明 - どの列から説明を取得するかを選択します。
    • Show attribute value imageを有効にすると、Image formulaフィールドが表示されます。そこで数式を使用してメディアギャラリーから画像を定義することができます。例をご覧ください。

Code Block
 return '/bi/


Code Block
media:showimage/'+imageId; 
    • Show actions formulaを有効にすると、Actions formulaフィールドが表示されます。これはアイコンとリンクを持つマップを返す必要があります。例をご覧ください。
Code Block
return [[icon:'edit',link:'report:89?ID='+id]]


  • ポイントの代わりにマーカーを表示。

  • マップ上の値を線でリンクします。線の太さを定義します。または、場所をリンクするために使用される線上のポイントを非表示にします。

  • PINsリンク - 特定のレポートを表示するポップアップウィンドウを開くアクションを定義することができます。
    • 変数は次のように渡すことができます: viewreport:287-Ty9CWFdvmo?parameter1=@parameter1
    • ドリルダウン値は、次のように渡すことができます: viewreport:287-Ty9CWFdvmo?parameter2=$attribute

属性を場所定義に関連付ける

ドリルダウン場所定義の間には非常に薄いつながりがあります。ドリルダウンではインジケータの値とその分類が維持されますが、場所定義では場所の識別とその座標のペアが保持されます。 BellaDatiは、属性のメンバーを場所に自動的に接続し、従ってそれらの適切な配置を可能にします。

Note

既存の場所定義に関連付けることができる属性のみを常に選択する必要があります。関連するGeoデータのない属性の場合、インジケータは適切に表示されません。


ドリルダウンオプションでは、以下を定義できます:

  1. 表示されるインジケータがどのようにグループ化および分類されるか。

  2. 視覚化されたデータが持つ粒度。

  3. どのマッピング背景が使用されるか(標準、白黒、グレースケール、アウトドア、Cycloなど)


場所定義オプションを使用して、選択した属性をGeoデータに関連付けます。

場所定義を以下に従って選択します:

  1. 選択したドリルダウンパス
  2. 適用したい視覚化のスタイル(ポイント vs リージョン)

場所定義には、場所IDとその座標の組み合わせが含まれます。

座標は次のように表すことができます:

  • ポイント。ポイント定義では、場所は正確な経度と緯度を表す値の組み合わせで識別されます。
  • リージョン。リージョン定義では、エリアは経度と緯度値のセットで構成されるポリゴンで制限されます。

場所定義の詳細については、Managing GEO Dataに進んでください。

Geoポイントの使用

Geoポイントは、特別な場所の緯度と経度の座標を保持する特別な属性タイプです。 Geoポイントは、インポートされたデータセットに位置情報が直接保存されている場合に使用すると最も便利です。独自の場所定義を自動的に生成し、レポートで直接使用できます。

Geoポイントを使用するには:

  1. ドリルダウン設定でGeoポイント属性を選択

  2. 関連するポイント定義を見つける

  3. 目的のマッププロバイダーを選択

マップの管理

挿入されたマップビューの右上隅で追加の操作を実行できます:

  • テーブル設定
  • フィルター設定 – Static Filtersに進む
  • ビューのエクスポート – Exporting Viewに進む
  • ダッシュボードへの追加
  • マップの移動

  • マップの複製

  • マップの削除


マップの設定

ツールボックスアイコンをクリックし、マップ設定ダイアログに入ります。

マップ設定ダイアログには、現在マップに適用されているインジケータドリルダウンパスが表示されます。BellaDatiでは次のことができます:

  • インジケータまたはドリルダウンパスダイアログの入力

  • ドリルダウンパスの削除

  • 時間軸の追加Setting Date Intervalに進みます

  • 条件付き書式の追加次の段落を参照


条件付き書式

マップで使用できる条件付き書式には、2つのタイプがあります。

  • インジケータの条件付き書式設定 - Displaying Indicators
    • 背景色は形状に適用され、前景色がポイントに適用されます。
    • 条件によって表示するピンのアイコンが変更できます

  • マップの条件付き書式設定 - 選択した色は、指定した値以下の値を持つドリルダウンメンバーに適用されます。複数のルールを使用して、独自の配色を作成できます。

インジケータの詳細に画像を表示

マップで使用される属性メンバーに追加された画像がある場合、この画像はインジケータの詳細にも表示されます。

Info

画像は属性メンバーの外観で管理できます。


マップレイヤー

すべてのレイヤーの上に、新しいレイヤーを設定することができます。このレイヤーはボタンでオンオフでき、色も定義でき、インジケータの値も計算式で定義できる。シェイプマップと同様の設定が可能です。

マップの設定で、マップレイヤーを選択します。

  • 名前 - この特定のレイヤーの名前
  • 基本色 - この色はあなたのレイヤーの色として使用されます。
  • Drill down by - ここで、ドリルダウンに使用する属性を指定します
  • 場所の定義 - データの適切な位置と視覚化のために、場所の定義を選択します。場所の定義の詳細については、GEOデータの管理を参照してください
  • 利用可能な場所の式 - 列からPlaces定義の値を選択する代わりに、式を使用してそれらの定義を定義できます。式は1つの値または値の配列を返さなければなりません。

  • アイコン - このレイヤーを有効または無効にするために右下隅で使用されるアイコンを選択します
  • 数式 - インジケータを設定する代わりに、数式を使用して値を定義します
  • マウスオーバーを有効にする - これにより、「Formula」とそのビジュアルを上書きする追加の式が有効になります。ラベルだけが表示され、その式の返された値が表示されます。
  • ラベルを有効にする - これにより、マップ内の場所の定義の上に式で定義されたテキストを配置する追加の式が有効になります。
  • キャンバスレイヤー - これは、マップ内に特別な情報を描画する特別な機能です。


通知設定

  • 通知- 関連するレイヤーをトリガーするすべてのシステム通知のリスト
  • タイムアウト - 通知の有効期間
  • 場所属性 - 通知の一部として場所が送信され、この属性の値が通知のソースデータセットに保存されている場合、それは場所の定義とペアになります。これらの条件が満たされると、カーソルを通知ラベルに重ねると場所がハイライト表示されます。この場合、通知を処理するソースデータセットに保存されている場所の属性名を設定します。


  • 場所属性でグループ化 - 場所属性で通知をグループ化できます。その場合、通知は場所の値を除いて一致するかどうかを比較し、すべての場所をハイライト表示したリストとして表示されます。


  • 利用可能な場所属性/式 - 通知として表示できる場所を指定できます。データセットから属性を選択するか、式を使用して定義できます。


    Code Block
    return ['Germany','Czech Republic']


  • ヘッダー属性 - 通知データセットから通知のヘッダーを定義する属性の名前を設定します。
  • 日時属性 - 通知データセットから日時を配置し、通知をそれに従ってソートする属性の名前を設定します。
  • アイコン - 特定の通知に情報を提供するアイコンを配置します。


通知

データセット通知で設定したルールに沿って、複数の通知のリストを表示できるようにします。通知の上にマウスを置くと、その部分がハイライト表示されます。

  • 通知設定で通知定義を作成します。通知アクションとして、"システム通知 "を使用します
  • マップの設定で「通知」を選択します。
  • 通知の選択で、[システム通知] を表示し、選択できるようにする必要があります
  • タイムアウトは、ページが再度読み込まれたときに、閉じた通知が表示されなくなるまでの時間を示します
  • 位置情報属性は、特定の通知の地域を地図上で強調表示することができます。この場合、すべての通知は、国名を強調表示します。
  • Header属性は、各通知のタイトルを表示します。
  • Datetime属性が設定されている場合、日付と時刻が表示されます。これは、通知を送信した時間ではなく、データセットからの時間です。
  • アイコン - 各通知はテキストの横に同じアイコンを置くことができます。

マップ上のリンクポイント

マップ内のポイントをリンクする場合は、リンク値オプションを選択します。この場合、値はマップで使用されるドリルダウンに基づいてリンクされます。ドリルダウンには、ポイントのシーケンスを含める必要があります。例: 視覚化された旅行のタイムスタンプ。

マップ上のポイントを強調表示する場合は、マーカーのいずれかを選択します(マーカーを表示オプション):

チュートリアルビデオ

HTML
<iframe width="560" height="315" src="https://www.youtube.com/embed/krQU1dkiU_0" frameborder="0" allow="accelerometer; autoplay; encrypted-media; gyroscope; picture-in-picture" allowfullscreen></iframe>


インジケータの条件付き書式インジケータの表示

...