Dashlet | A basic item of the dashboard. Dashlets usually represent your existing views (tables, charts) from reports. Another types of dashlets have informational, supplemental or customizing function. |
Datasource | Data source is typically a database, Microsoft Excel spreadsheet, text file or another services eg. Google Doc spreadsheet, Facebook or enterprise services like CRMs (SalesForce, Amiando etc.). |
| Data Units | Whole virtual space of the one registered organization. Users of one domain can't access data in another domains. Domains are completely independent. Separate domains can also be suitable for individual divisions or SBUs of large international companies. |
Domain | 一つの登録された組織のバーチャルなスペースです。一つのドメインのユーザーは他のドメインのデータにアクセスできません。別のドメインはそれぞれの部門や大きな国際企業のSBUで使うことができます。 |
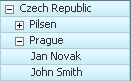
Drill-down | An operation which results in displaying more detailed data with higher granularity according to the chosen drill-down path. If you drill-down a member, you will see its child members. Eg. drill-down of particular affiliate can display its employees. 選択された、ドリルダウンコースに従い精度の高い詳細なデータを表示する結果を得るためのオペレーションです。もし、メンバーをドリルダウンするなら、その子供のメンバーまで見られます。例えば、ある組織をドリルダウンするならその従業員を表示できます。
 |
Drill-down | ドリルダウンの結果に影響を及ぼすアトリビュトの系列です。データセットかレポートの選ばれたアドホックで決定されます。
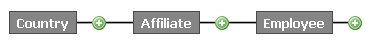 Image Removed Image Removed |
ファクト | ファクトはデータセットインディケーターと同等です。 |
フィルター | フィルターは選ばれたメンバーのみか一般的なメンバーのマッチパターンにより、ビュー表示データを制限します。例えば、ユーザーはテーブルかチャートの最大の都市のみ表示します。一般的なフィルター設定はまたデータセット共有の時、利用できます. |
フォーミュラ | フォーミュラはユーザーに自身の新しいインディケーターを定義させる機能です。共通の数学的公式を使うにもかかわらず、回帰あるいは時間内に既存のインディケーターの違った値を得る、あるいは、その集合体に依存するなどの進んだ機能が可能です |
ジオデータ | ジオデータは場所の決定、そのコーデネーションのペアです。BellaDatiでは場所はポイントと地域を表します。経度と緯度のコーデネーション単一のペアでポイントが決定され、地域は多角地域を作る複数のポイントで構成されます。 |
| ジオポイント | ジオポイントはアトリビュトのタイプの1つです。ジオポイントは経度と緯度のコーデネーションの情報を含み、その特定のロケーションにデータを区画し、ジオマップのビュータイプで使うことができます。 |
グループインディケーター | グループインディケーターは同類(例、賃金、構成要素)を持つインディケーターを含む一つかそれ以上で構成されます。ユーザーは単一のインディケーターと全体のグループと効果的に働けます。 |
アイフレーム | アイフレームはHTMLコードを使い外部のウエブサイトへ分析的なビューをはめ込める機能です。 |
結合データセット | 抽象的なデータセットは2つかそれ以上のデータセット表しています。これはユーザーにちがつたデータソースからデータの複数の従属を分析させる機能で、メンバーの名前(コードブック)へメンバーの証明書を決めます。データセットは特定された状況でー内部、外部、あるいは双方などー連結することができます。統合データセットはデータセットソースの変更を反映します。 |
メンバー集合体 | メンバー集合体は1メンバーのデータレコードの繰り返しが(1度に)積み重なる方法を特定します。集合の可能性は、足し算、平均、最小値、最大値とカウント(違ったメンバーを’数える)です。 |
メトリックス | メトリックスはレポートインディケーターと同等です。 |
ニュース | ダシュレットはドメイン内のレポートとデータセット内の主要な実際と以前の変更を表示します。このダッシュレットはこれらの変更の責任者の情報を表示します。 |
ピボットテーブル | フレキシブルな列とコラム形式の分析的なビューです。ユーザーは各線(多様なアトリビュト、インディケーター、時間単位)を表示させるものを調整し、今の図表のドリルダウンコースの構成を選びます。条件的フォーマッテイングでピボットテーブルのインディケーターを分析することも可能です。 |
既定義取込 | 既定義取込はツールで、ユーザーに繰り返しの取り込み中に最初の取り込みからのコラムのセッテイングを簡単にアップロードします。 |
クエリースケジュール | クエリースケジュールは通常のデータ同時化をスケジュールし、コントロールします。その主要な目的はデータソースからの実際のデータのデータ倉庫をアップデートします。 |
ロールアップ | ロースアップは選択されたドリルダウンコースに従い、低い精度でのおおよそのデータを表示する機能です。 |
サンプルデータ | 事前に決められた内容、レポートの構成、ダッシュボード、データベース、既定義取り込みです。 |
シェアリング | シェアリングはユーザー間の協力、共同作業のための機能です。同じドメイン内の他のユーザーとデータセット、レポート、ダッシュボードを共有できます。データセットとレポートを編集する許可を他のユーザーに与えることも選択できます。アイフレーム、アイグーグル、は別の共有ツールで、インターネット上での公開、企業内でのビューを共有する機能です。 |
| サブセット | サブセットはアトリビュトのバーチャルなコピーで希望のメンバーのみ選べます。サブセットメンバーは自由にオーダーを設定できます。 |
タイムアグリゲーション | タイムアグリゲーションは高い精度での時間単位が低い精度で単位に積み重なるやり方を特定します。例えば、ユーザーが日でデータを集めたい、月で表示したい場合は、タイムアグリゲーションは月単位が日の記録を含んだ足し算、平均、最大値、最小値、カウントを表示します。 |
| タイムシリーズ | タイムシリーズはタイムアグリゲーションの別のやり方です。データユニットと対照的に、タイムシリーズは値積み重ね、連続した時間の軸で表示します。 |
| トランスレーション | トランスレーションはコラムタイプのデータセットの1つです。トランスレーションはメンバーのアトリビュト(価値)の言語解釈を保持します。 |
ユーザーグループ | ユーザーグループは個人のユーザーのセットです。ドメインアドミニストレーターはグループを作り、削除、編集する権利を持ちます。アドミニストレーターはグループ内でのユーザーの役割を与え、グループからユーザーを削除し、加える事もできます。ユーザーグループは非常に役立つ機能です。それは、ユーザーはレポートをシェアでき、すべてのメンバ-を選択する代わりに全体のグループとデータセットを共有できます。 |
ユーザーロール | ユーザーロールは違ったタイプのユーザーのためにちがつた機能へアクセスを分離するためにデザインします。利用可能なユーザーロールはドメインアドミニストレーター、レポート編集、データマネージャーです。これらの役割は制限なしに結合できます。ドメインアドミニストレーターのみが他のユーザーにこれらの役割を与える権利を持ちます。 |
path | A sequence of attributes which influences the results of the drill-down operation. It can be defined in the data set or chosen ad-hoc in the report.
Image Added |
Fact | Facts are equal to the data set indicators. |
Filters | Filters restricts data displayed in views according to selected members only or general member match pattern. Eg. you can set filter to show only the largest cities in a table or chart. General filter settings are also available when sharing data sets. |
Formula | Formula is a tool allowing user to define its own new indicators. Despite using common mathematical functions, advanced functions such as regressions or getting different values of existing indicators in time or depending on their aggregation is possible. |
Geo data | Geo data are pairs of location identification and its coordinates. In BellaDati, location can be represented as point or region. While point is identified by single pair of longitude and latitude coordinates, region comprises of multiple points creating the polygonal area. |
| Geo point | Geo point is one of the attribute types. It holds information about latitude and longitude coordinates and can be used in Geo Map view type to plot data into its particular location. Alternative to Geo points are separately maintained Geo Data. |
Group of indicator | Group of indicator consists of one or more included indicators which have the same context (eg. wage components). Users can effectively work with the whole group like with a single indicator. |
iFrame | iFrame is a feature, which allows users to embed their analytic views into the external website using HTML code. |
Joined Dataset | An abstract data set, which represents data from two or more source data sets. This allows user to analyze mutual dependencies of data from different data sources or can easily assign member IDs to their names (codebook). Data sets can be connected together according specified condition - inner, outer or cross join. Joined data set reflects all the changes in the source data sets. |
Member Aggregation | Specifies the way, how the repeating data records of one member are aggregated (in one time unit). The aggregation possibilities are: sum, average, minimum, maximum and count (of different members). |
Metric | Metrics are equal to the report indicators. |
News | Dashlet, which shows actual and former changes mainly in reports and data sets within the domain. This dahlet also displays information about the author of those changes. |
Pivot Table | An analytic view in a form of flexible rows and columns. Users can adjust, what should be displayed on each axis (various attributes, indicators or time units) and choose the structure of the drill-down path for the current table. It is also possible to analyze indicators in pivot table through the conditional formatting. |
Predefined import | Predefined import is a tool, which allows users to easily load columns settings from the first import during repeated imports. |
Query Scheduler | A tool, which allows to schedule and control regular data synchronization. It's main purpose is to update data warehouse with actual data from data sources. |
Roll-up | An operation, which displays less detailed data with lower granularity according to the chosen drill-down path. It's an inverse operation to drill-down. |
Sample data | A set of predefined content, consisting of reports, dashboards, data sets and predefined imports. |
Sharing | Sharing is a feature, which allows collaboration and cooperation among users. It's possible to share your data sets, reports or dashboards with other users in the same domain. You can also choose to delegate permission to edit your data sets and reports. Besides iFrame and iGoogle are another sharing tools, which allows you to share your views on corporate intranet or publicly via Internet. |
| Subset | Subset is a virtual copy of Attribute which holds only desired members. Subsets members can have custom order. |
Time aggregation | Specifies the way, how time units with higher granularity are aggregated in the units with lower granularity. If you (for example) gather data in days but display them in months, the time aggregation determines if the "month" units show sum, average, maximum, minimum or count of the included day records. |
| Time Series | Time Series in another way of date aggregation. In contrast to Date Units, it aggregates values but displays them on continuous time axis. |
| Translation | Is one of the Data Set column type. It holds language translation of Attribute members (values). |
User group | A set of individual users. The Domain administrator has a right to create, delete or edit these groups. He also adds new users to groups, remove users from groups and assigns user roles to the groups. User group is a very useful tool, because users can share their reports or data sets with the whole group instead of choosing of all its individual members. |
User roles | User roles are designed to separate access to different functions for different types of users. Available user roles are "Domain administrator", "Report editor" and "Data manager". These roles can be combined without any restrictions. Only the Domain administrator has a right to delegate those roles to other users. |
View | ビュー | Basic element of the report - displays values of the indicators depending on user's criteria. Views represent flexible points of view to the user's data in a form of pivot table, chart or possibly custom content. Views allow you to use the "slice and dice" features. ビューはレポートの基本要素です。ビューはユーザーの基準により、インディケーターの値を表示します。 |