Base concepts
Attributes are describing indicators, usually in a form of general terms such as "country", "department", "product", "employee", etc. Attributes consist of members (attribute values, instances) eg. "Czech Republic", "Sales Department", "Product XY", "John Smith". For example, a Sales record could have attributes such as sales person, store, region, date, etc. | |
Dashboard typically consists of the most important tables or charts from reports and is primarily determined for managers who need quick overview of actual company situation. Special custom content can be added to every dashboard as a customization. Dashboards can also be shared for public via web. | |
A virtual database of BellaDati's integrated data warehouse. Each data set usually represents data with similar characteristics (e.g. invoices, wages, costs) from one data source. Data set consists of data set dates, indicators, attributes and attribute translations. Each report is built on single data set. More data sets can also be joined together. | |
Data set indicators are defined within the data set and are available as musters for report indicators. Other settings (like aggregations, appearance, etc.) are not supported. Simply said, the data set indicators represents a raw numerical value (in the OLAP language it is a fact) with basic attributes - name, unit and rounding mode. Values of these indicators are straightforwardly stored in BellaDati's data warehouse directly from imported data. | |
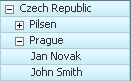
Member / Attribute value | "Instance" of one attribute. For example, members of the "employee" attribute may be "Jan Novak", "John Smith" etc.
|
Record | Particular data row stored in the data set. Each record consists of indicator values, attribute values and date/time information and has the same structure within single data set. |
An analytic output, providing answers to user's research according to the gathered data. Each report can contain description, tags and consists of one or more views (charts and pivot tables), comments and possibly attachments. | |
Report indicators are created in the report from the data set indicators or ad hoc. Unlike the data set indicators, report indicators are supporting wide range of various settings - member aggregation, time aggregation, appearance, conditional formatting, extended formula support with report variables etc. |
Detailed glossary
Term | Meaning |
|---|---|
Notifies data manager about changes in indicator's values in a particular data set according fulfillment of one or more predefined conditions. | |
Graphic representation of analytic data view. There are a lot of chart types in BellaDati - eg. line chart, pie chart, bar chart, stack bar chart, horizontal bar chart, radar chart, horizontal heat map. Each of them offers a different way how to explore particular dimensions (time, indicators and attributes). | |
A short message or explaining information attached to report or table cells. | |
Conditional formatting allows user to adjust appearance of the particular indicators in table according to currently displayed values or their changes. | |
Copy | A clone of the existing report, table or chart. Any future change of the copy does not affect the original. |
A basic item of the dashboard. Dashlets usually represent your existing views (tables, charts) from reports. Another types of dashlets have informational, supplemental or customizing function. | |
Data source is typically a database, Microsoft Excel spreadsheet, text file or another services eg. Google Doc spreadsheet, Facebook or enterprise services like CRMs (SalesForce, Amiando etc.). | |
| Data Units | Whole virtual space of the one registered organization. Users of one domain can't access data in another domains. Domains are completely independent. Separate domains can also be suitable for individual divisions or SBUs of large international companies. |
Domain | 一つの登録された組織のバーチャルなスペースです。一つのドメインのユーザーは他のドメインのデータにアクセスできません。別のドメインはそれぞれの部門や大きな国際企業のSBUで使うことができます。 |
Drill-down | 選択された、ドリルダウンコースに従い精度の高い詳細なデータを表示する結果を得るためのオペレーションです。もし、メンバーをドリルダウンするなら、その子供のメンバーまで見られます。例えば、ある組織をドリルダウンするならその従業員を表示できます。 |
ドリルダウンの結果に影響を及ぼすアトリビュトの系列です。データセットかレポートの選ばれたアドホックで決定されます。 | |
ファクト | ファクトはデータセットインディケーターと同等です。 |
フィルターは選ばれたメンバーのみか一般的なメンバーのマッチパターンにより、ビュー表示データを制限します。例えば、ユーザーはテーブルかチャートの最大の都市のみ表示します。一般的なフィルター設定はまたデータセット共有の時、利用できます. | |
フォーミュラはユーザーに自身の新しいインディケーターを定義させる機能です。共通の数学的公式を使うにもかかわらず、回帰あるいは時間内に既存のインディケーターの違った値を得る、あるいは、その集合体に依存するなどの進んだ機能が可能です | |
ジオデータは場所の決定、そのコーデネーションのペアです。BellaDatiでは場所はポイントと地域を表します。経度と緯度のコーデネーション単一のペアでポイントが決定され、地域は多角地域を作る複数のポイントで構成されます。 | |
| ジオポイント | ジオポイントはアトリビュトのタイプの1つです。ジオポイントは経度と緯度のコーデネーションの情報を含み、その特定のロケーションにデータを区画し、ジオマップのビュータイプで使うことができます。 |
グループインディケーターは同類(例、賃金、構成要素)を持つインディケーターを含む一つかそれ以上で構成されます。ユーザーは単一のインディケーターと全体のグループと効果的に働けます。 | |
アイフレーム | アイフレームはHTMLコードを使い外部のウエブサイトへ分析的なビューをはめ込める機能です。 |
抽象的なデータセットは2つかそれ以上のデータセット表しています。これはユーザーにちがつたデータソースからデータの複数の従属を分析させる機能で、メンバーの名前(コードブック)へメンバーの証明書を決めます。データセットは特定された状況でー内部、外部、あるいは双方などー連結することができます。統合データセットはデータセットソースの変更を反映します。 | |
メンバー集合体は1メンバーのデータレコードの繰り返しが(1度に)積み重なる方法を特定します。集合の可能性は、足し算、平均、最小値、最大値とカウント(違ったメンバーを’数える)です。 | |
メトリックス | メトリックスはレポートインディケーターと同等です。 |
ダシュレットはドメイン内のレポートとデータセット内の主要な実際と以前の変更を表示します。このダッシュレットはこれらの変更の責任者の情報を表示します。 | |
フレキシブルな列とコラム形式の分析的なビューです。ユーザーは各線(多様なアトリビュト、インディケーター、時間単位)を表示させるものを調整し、今の図表のドリルダウンコースの構成を選びます。条件的フォーマッテイングでピボットテーブルのインディケーターを分析することも可能です。 | |
既定義取込はツールで、ユーザーに繰り返しの取り込み中に最初の取り込みからのコラムのセッテイングを簡単にアップロードします。 | |
クエリースケジュール | クエリースケジュールは通常のデータ同時化をスケジュールし、コントロールします。その主要な目的はデータソースからの実際のデータのデータ倉庫をアップデートします。 |
ロールアップ | ロースアップは選択されたドリルダウンコースに従い、低い精度でのおおよそのデータを表示する機能です。 |
サンプルデータ | 事前に決められた内容、レポートの構成、ダッシュボード、データベース、既定義取り込みです。 |
シェアリング | シェアリングはユーザー間の協力、共同作業のための機能です。同じドメイン内の他のユーザーとデータセット、レポート、ダッシュボードを共有できます。データセットとレポートを編集する許可を他のユーザーに与えることも選択できます。アイフレーム、アイグーグル、は別の共有ツールで、インターネット上での公開、企業内でのビューを共有する機能です。 |
| サブセット | サブセットはアトリビュトのバーチャルなコピーで希望のメンバーのみ選べます。サブセットメンバーは自由にオーダーを設定できます。 |
タイムアグリゲーションは高い精度での時間単位が低い精度で単位に積み重なるやり方を特定します。例えば、ユーザーが日でデータを集めたい、月で表示したい場合は、タイムアグリゲーションは月単位が日の記録を含んだ足し算、平均、最大値、最小値、カウントを表示します。 | |
| タイムシリーズ | タイムシリーズはタイムアグリゲーションの別のやり方です。データユニットと対照的に、タイムシリーズは値積み重ね、連続した時間の軸で表示します。 |
| トランスレーション | トランスレーションはコラムタイプのデータセットの1つです。トランスレーションはメンバーのアトリビュト(価値)の言語解釈を保持します。 |
ユーザーグループは個人のユーザーのセットです。ドメインアドミニストレーターはグループを作り、削除、編集する権利を持ちます。アドミニストレーターはグループ内でのユーザーの役割を与え、グループからユーザーを削除し、加える事もできます。ユーザーグループは非常に役立つ機能です。それは、ユーザーはレポートをシェアでき、すべてのメンバ-を選択する代わりに全体のグループとデータセットを共有できます。 | |
ユーザーロールは違ったタイプのユーザーのためにちがつた機能へアクセスを分離するためにデザインします。利用可能なユーザーロールはドメインアドミニストレーター、レポート編集、データマネージャーです。これらの役割は制限なしに結合できます。ドメインアドミニストレーターのみが他のユーザーにこれらの役割を与える権利を持ちます。 | |
Basic element of the report - displays values of the indicators depending on user's criteria. Views represent flexible points of view to the user's data in a form of pivot table, chart or possibly custom content. Views allow you to use the "slice and dice" features. ビューはレポートの基本要素です。ビューはユーザーの基準により、インディケーターの値を表示します。 |
An operation which results in displaying more detailed data with higher granularity according to the chosen drill-down path. If you drill-down a member, you will see its child members. Eg. drill-down of particular affiliate can display its employees.
Overview
Content Tools