Page History
| Sv translation | ||
|---|---|---|
| ||
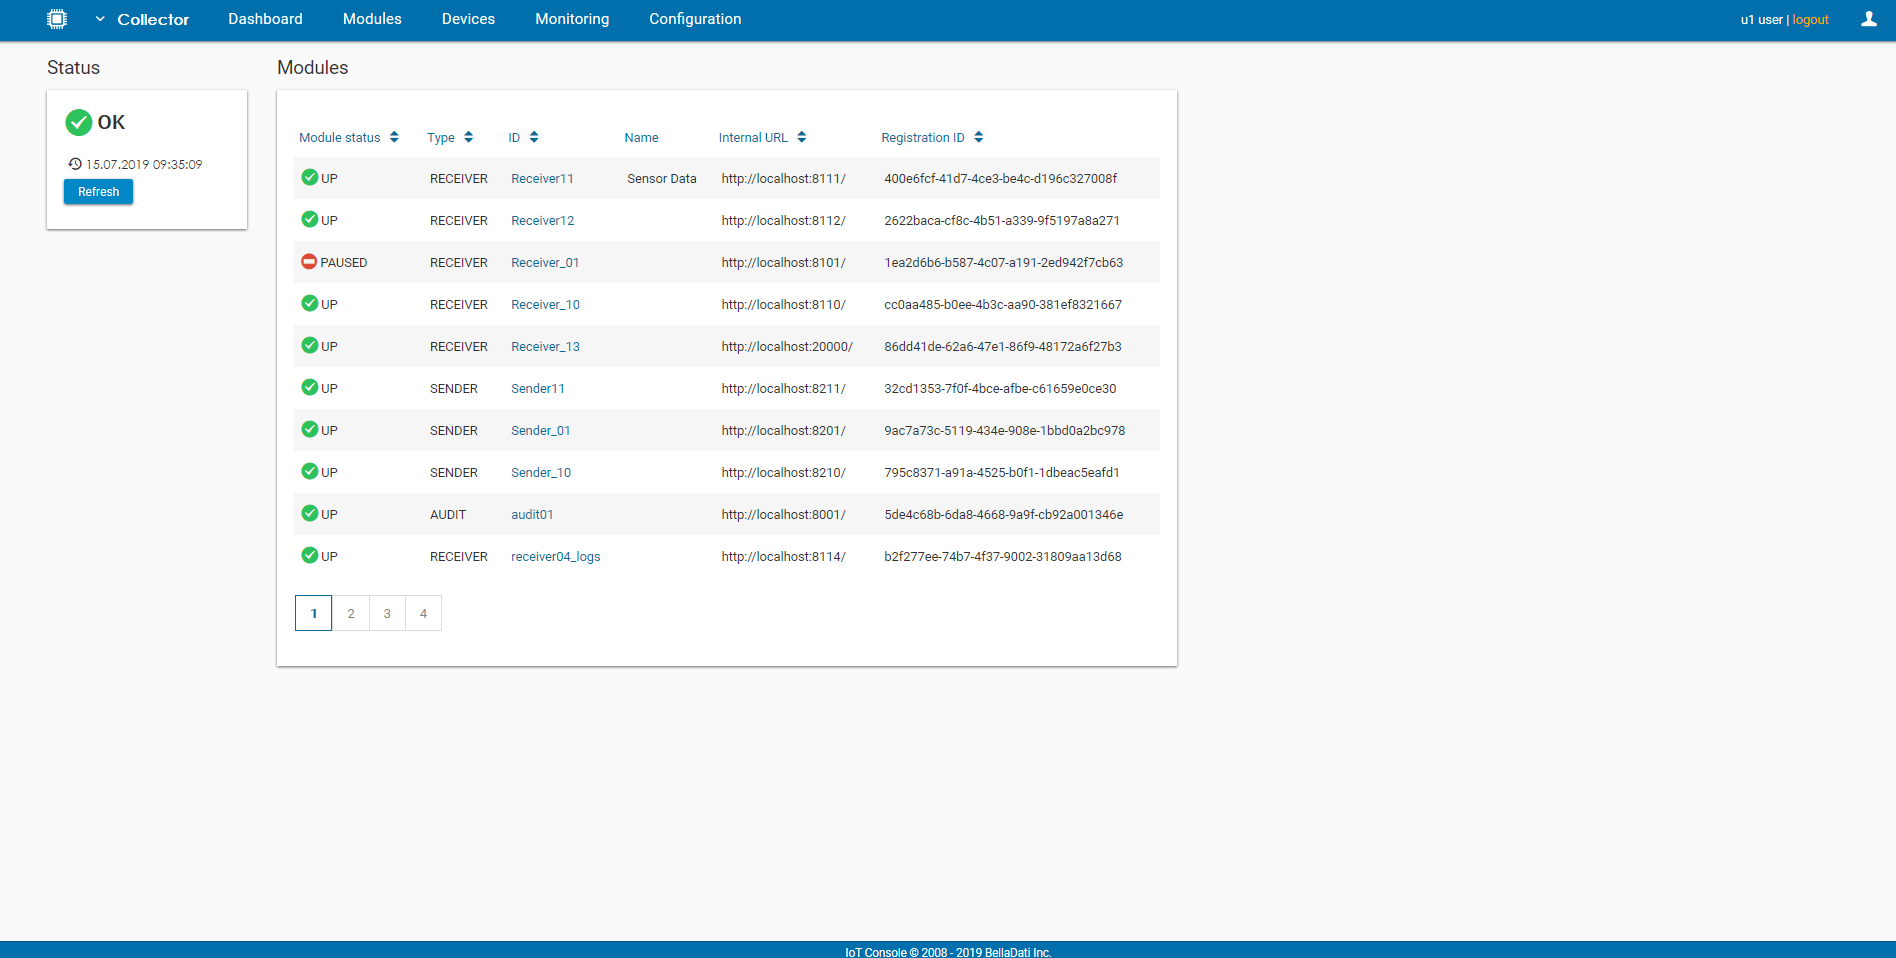
The dashboard serves and an entry point of the Management Console. It displays the status of the Collector and its modules. The page is divided into two boxes:
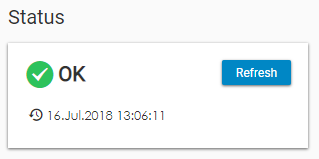
StatusThe Status box displays the status of the IoT Data Collector. The button Refresh is used to load the latest data from the Audit. The date and time of last update can be found at the bottom of this box.
ModulesThe Modules box displays a list of all available modules and basic information about each one of them (Status, Type, ID, Name, Internal URL, Registration). Users can change the order of the table by clicking on the header. The detail of a module can be opened by clicking on the row or the name of the module.
|
| Sv translation | ||
|---|---|---|
| ||
The dashboard serves and an entry point of the Management Console. It displays the status of the Collector and its modules. The page is divided into two boxes:
StatusThe Status box displays the status of the IoT Data Collector. The button Refresh is used to load the latest data from the Audit. The date and time of last update can be found at the bottom of this box.
ModulesThe Modules box displays a list of all available modules and basic information about each one of them (Status, Type, ID, Name, Internal URL, Registration). Users can change the order of the table by clicking on the header. The detail of a module can be opened by clicking on the row or the name of the module.
|
Overview
Content Tools