Page History
| Sv translation | ||
|---|---|---|
| ||
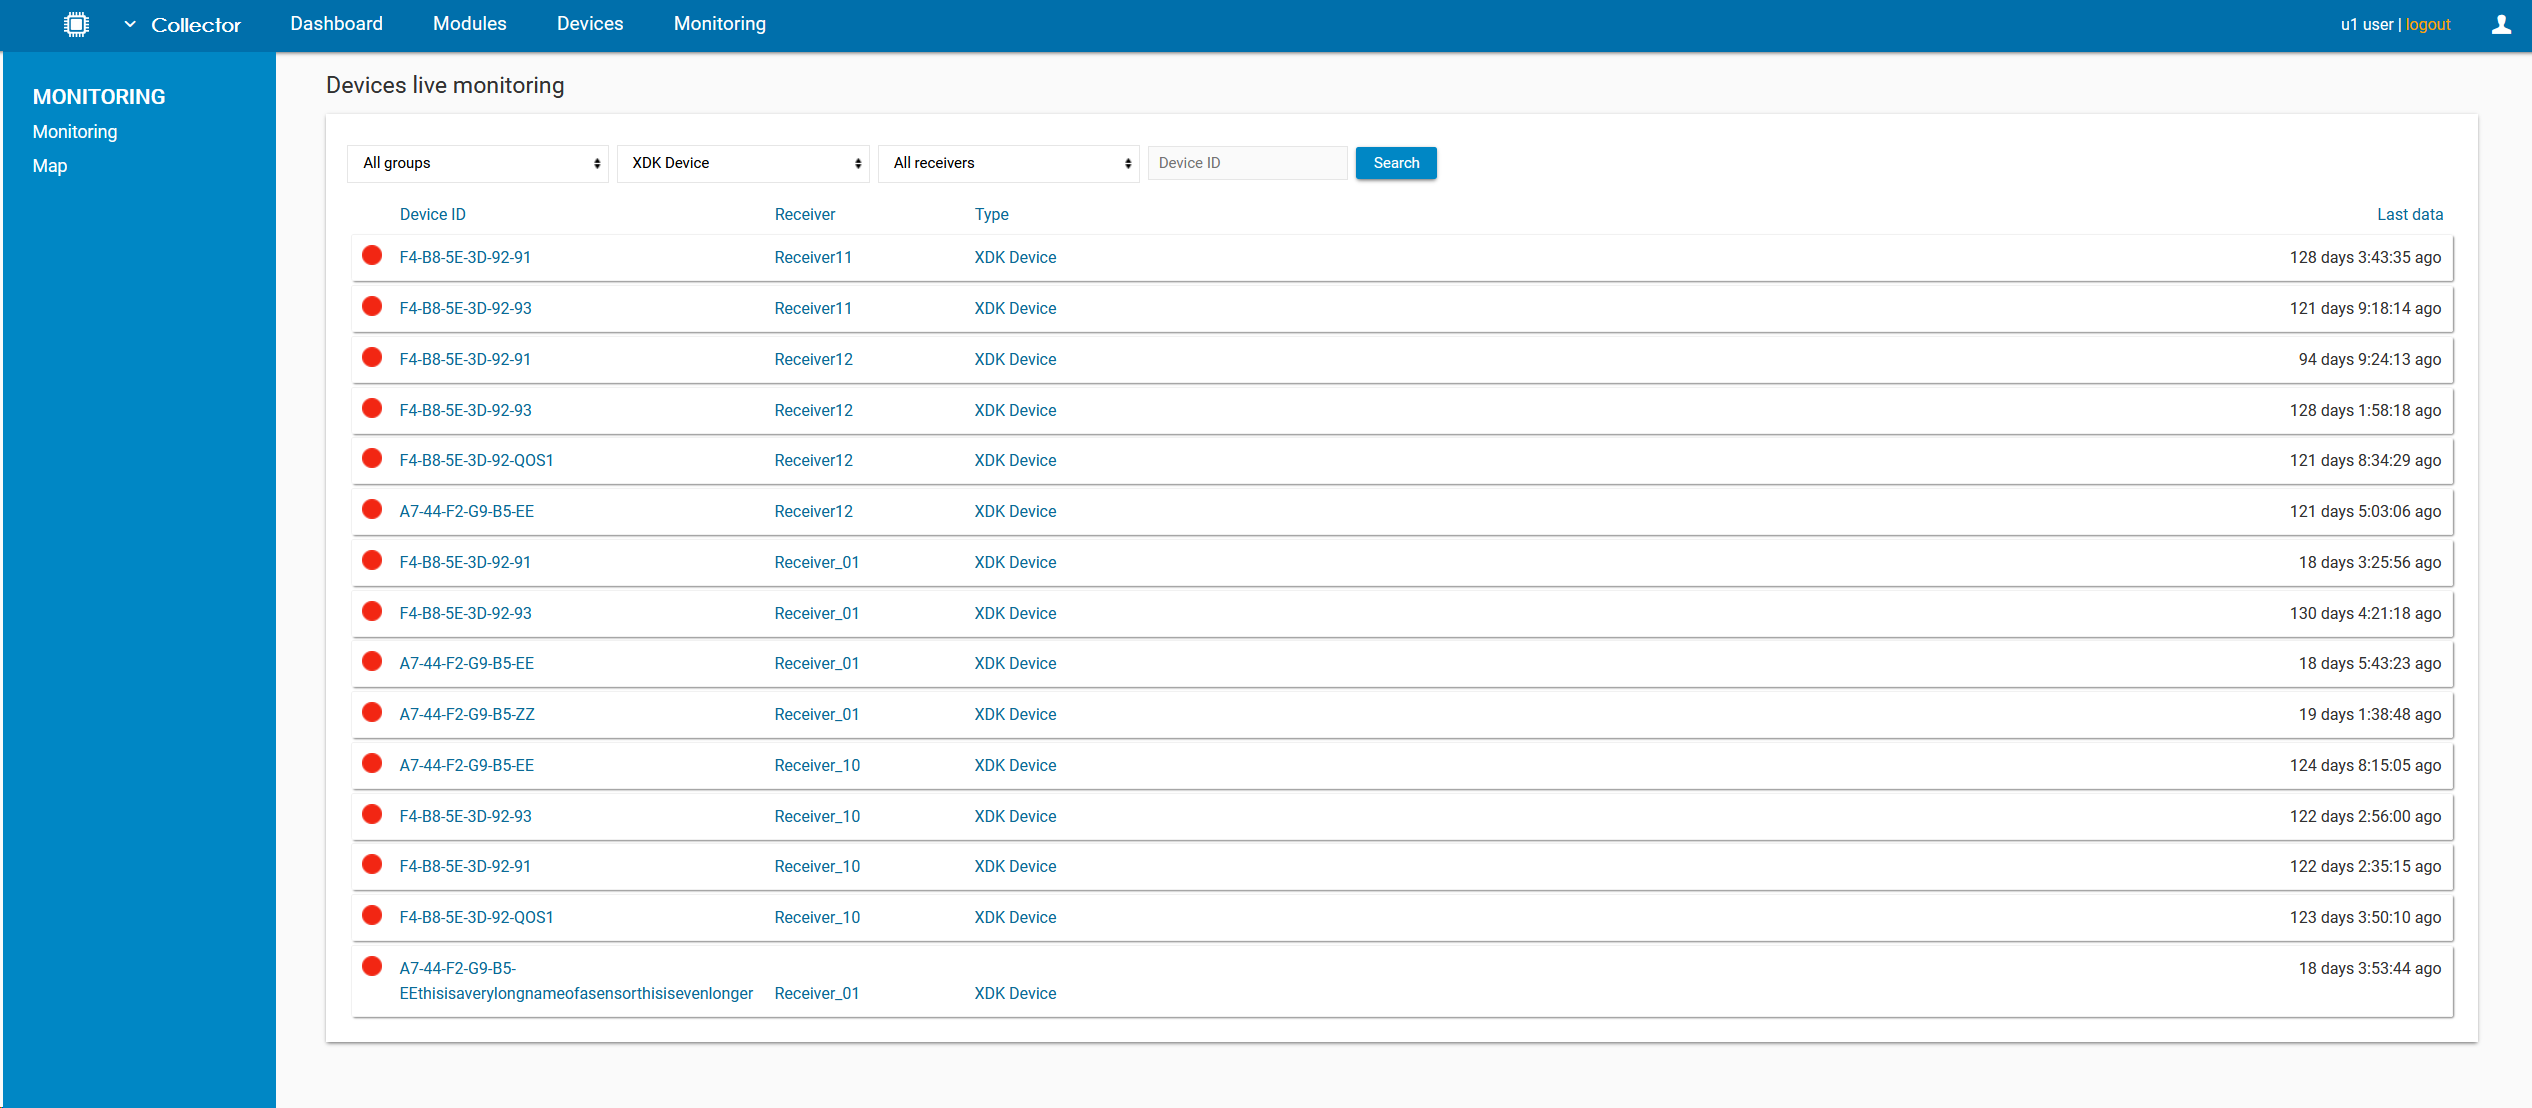
Users can monitor all the devices which are or were sending the data to the IoT Data Collector. The circle next to the Device ID shows the status of the device (red - offline, yellow - unknown, green - online). The column "Last data" displays the date and time of last received data. It is possible to filter the list by Group, Type, Receiver or by Device ID.
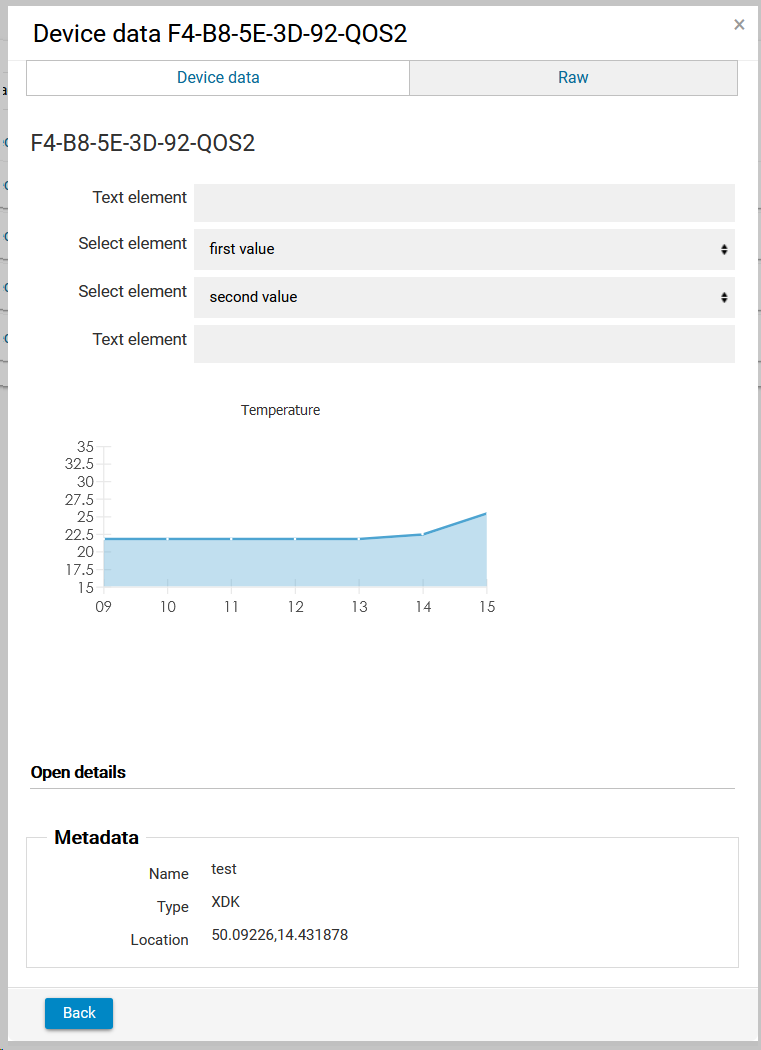
By clicking on the Device ID, it is possible to open the device data. By default, they are displayed in raw format as a JSON. When the Live Elements JSON is defined, it is possible to display the device data and also additional elements in a user-friendly way. Users can define various HTML elements for visualization and controlling.
|
| Sv translation | ||
|---|---|---|
| ||
ユーザーは、IoT DataCollectorにデータを送信しているまたは送信していたすべてのデバイスを監視できます。デバイスIDの左側の丸は、デバイスのステータスを示します (赤-オフライン、黄-不明、緑-オンライン)。 [最後のデータ]列には、最後に受信したデータの日付と時刻が表示されます。 グループ、タイプ、レシーバー、デバイスIDでリストをフィルタリングすることができます。
デバイスIDをクリックすると、デバイスデータを開くことができます。デフォルトでは、JSONとして生の形式で表示されます。 Live Elements JSONを定義すると、デバイスデータと追加の要素をユーザーフレンドリーな方法で表示できます。ユーザーは、視覚化と制御のために様々なHTML要素を定義できます。 Users can monitor all the devices which are or were sending the data to the IoT Data Collector. The circle next to the Device ID shows the status of the device (red - offline, yellow - unknown, green - online). The column "Last data" displays the date and time of last received data. It is possible to filter the list by Group, Type, Receiver or by Device ID.
By clicking on the Device ID, it is possible to open the device data. By default, they are displayed in raw format as a JSON. When the Live Elements JSON is defined, it is possible to display the device data and also additional elements in a user-friendly way. Users can define various HTML elements for visualization and controlling.
|
Overview
Content Tools