Page History
| Sv translation | |||||||||||||||||||||||||
|---|---|---|---|---|---|---|---|---|---|---|---|---|---|---|---|---|---|---|---|---|---|---|---|---|---|
| |||||||||||||||||||||||||
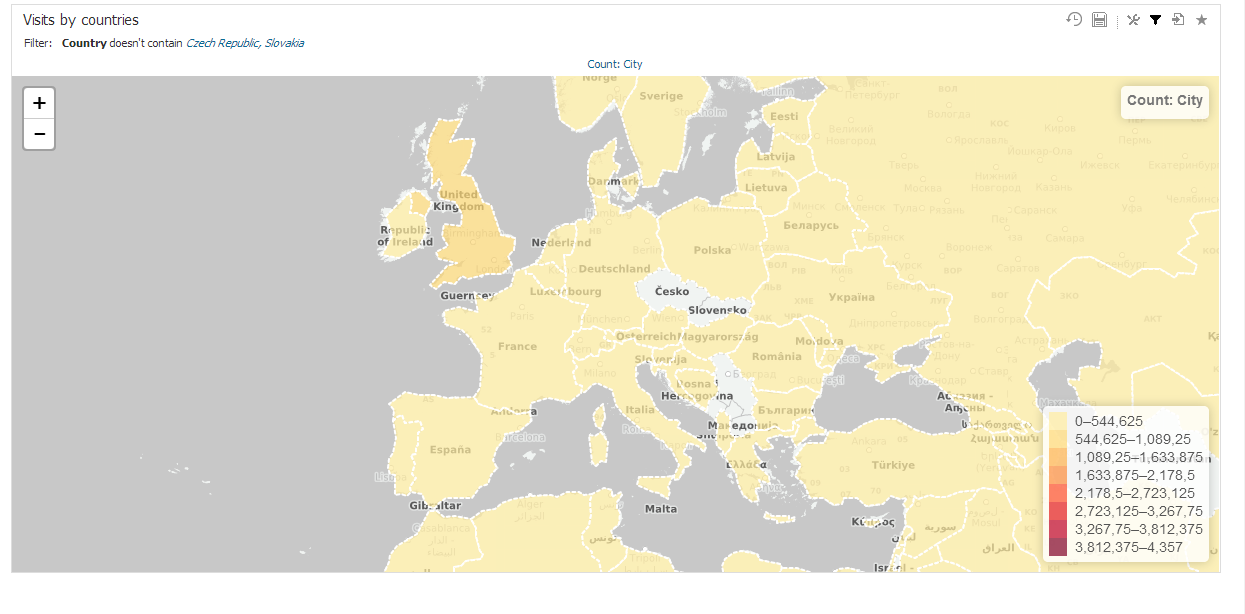
BellaDati supports data visualisation on geo maps by using two options:
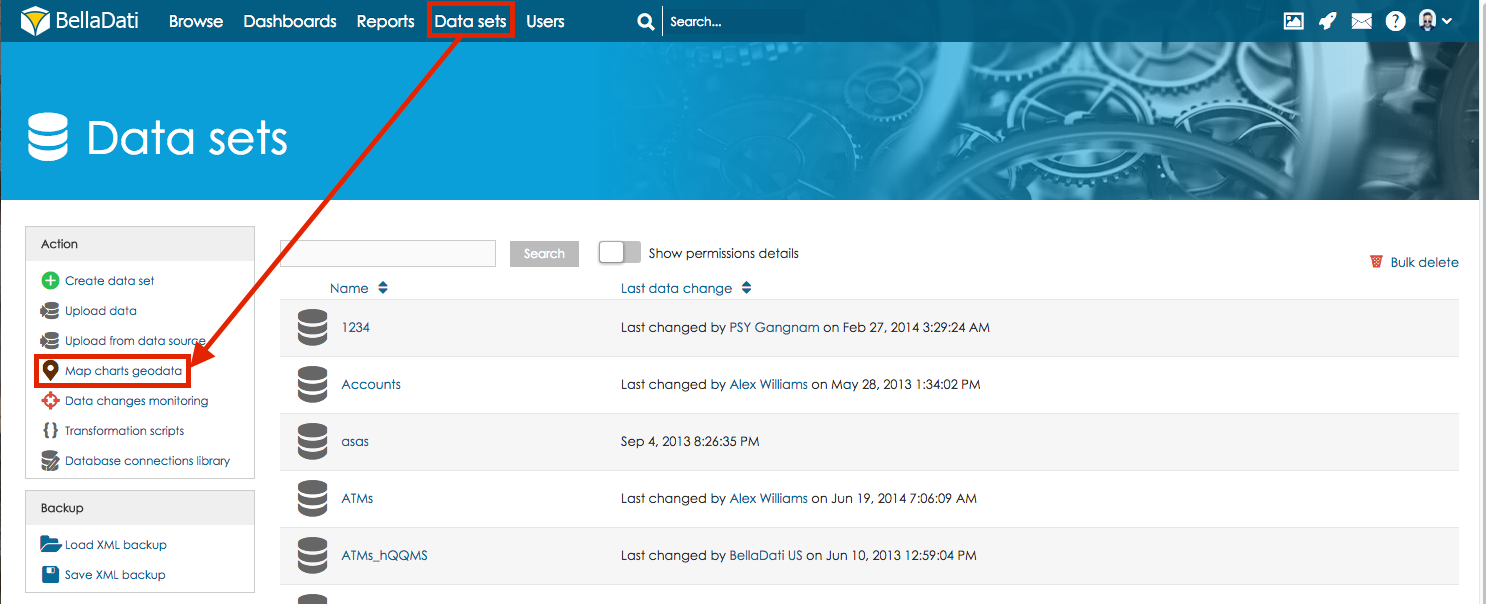
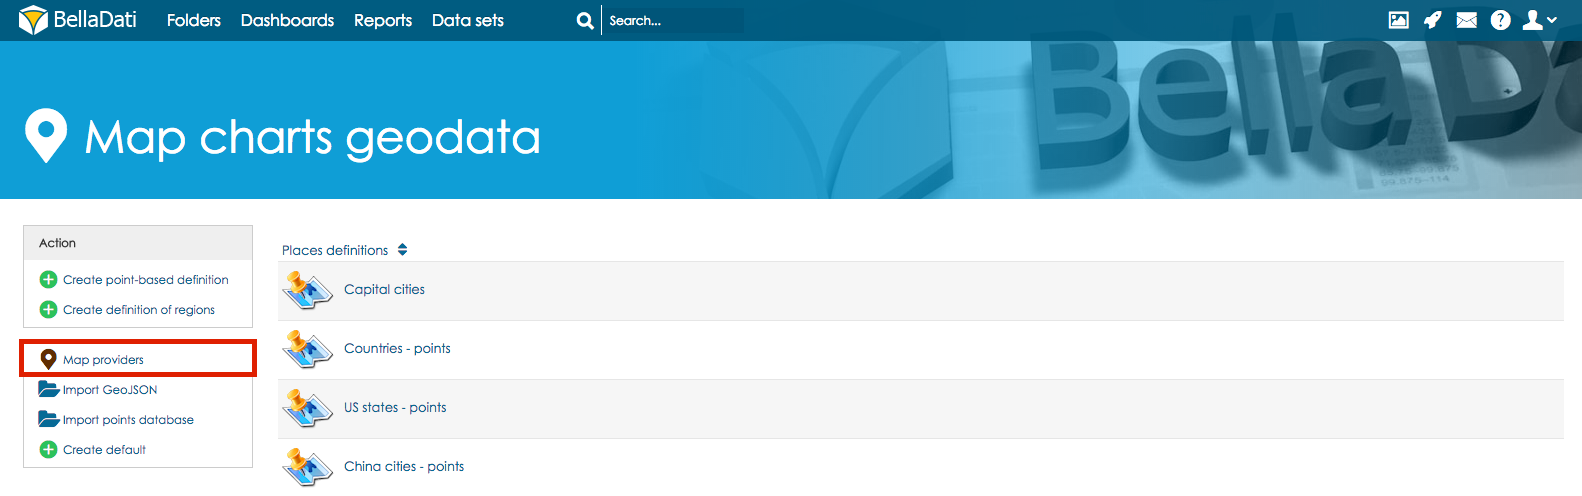
Map charts geodata screenIn the Data set menu screen click on the Map charts geodata to manage GEO points, regions and map providers.
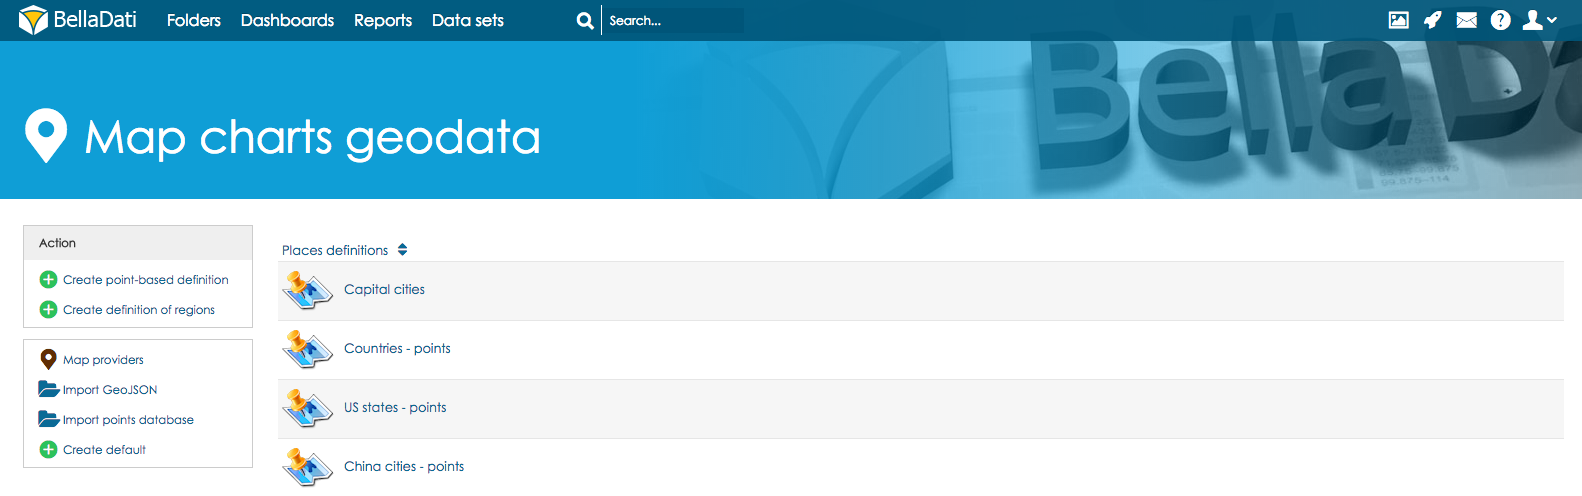
Available actions on Map charts geodata screen are:
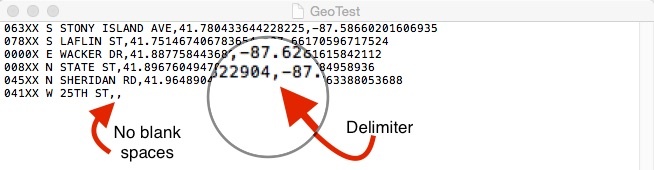
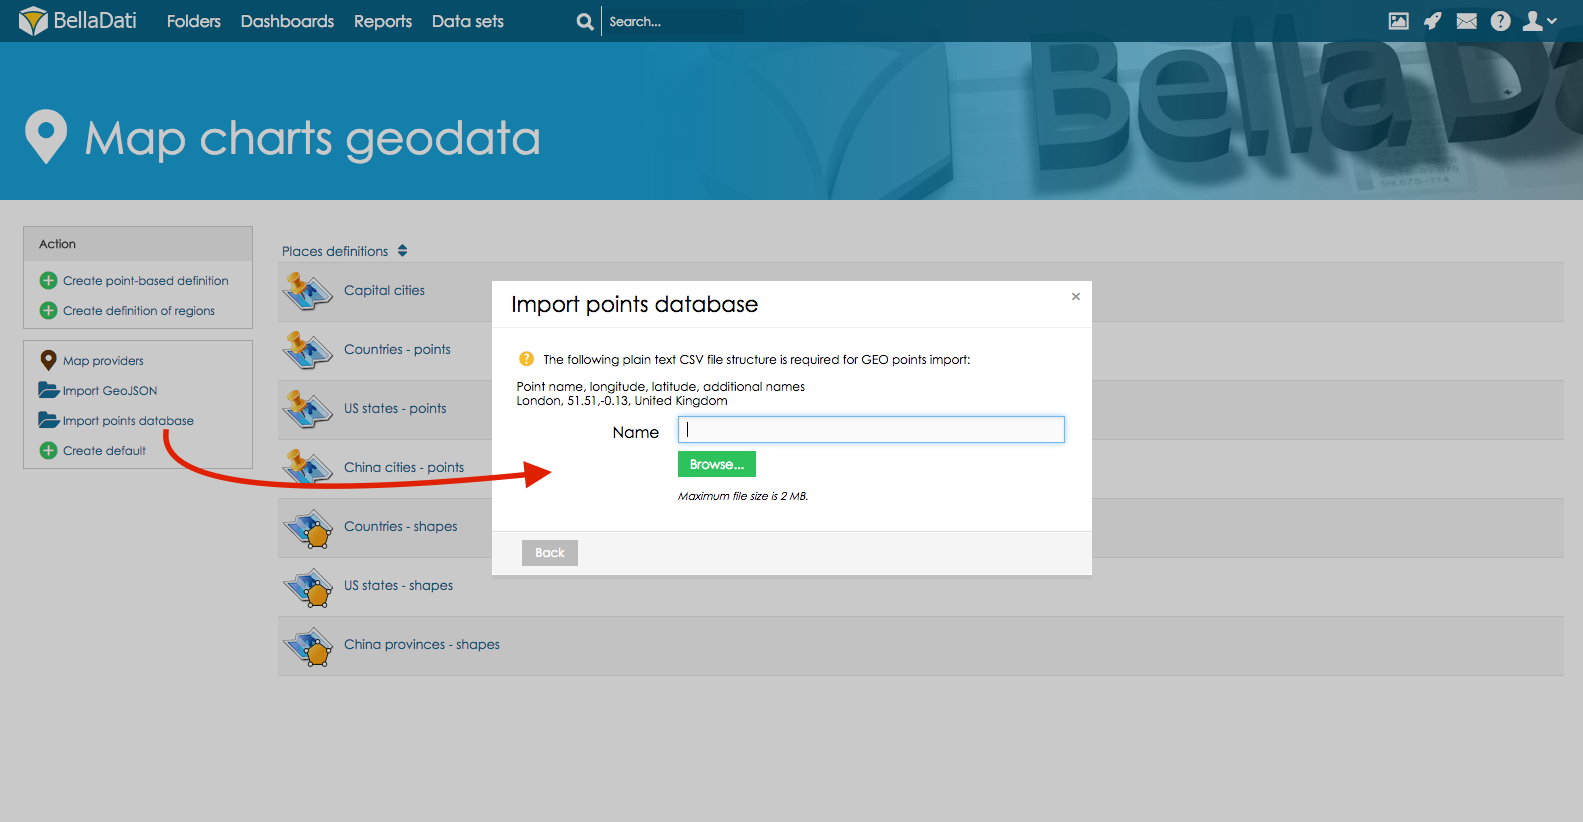
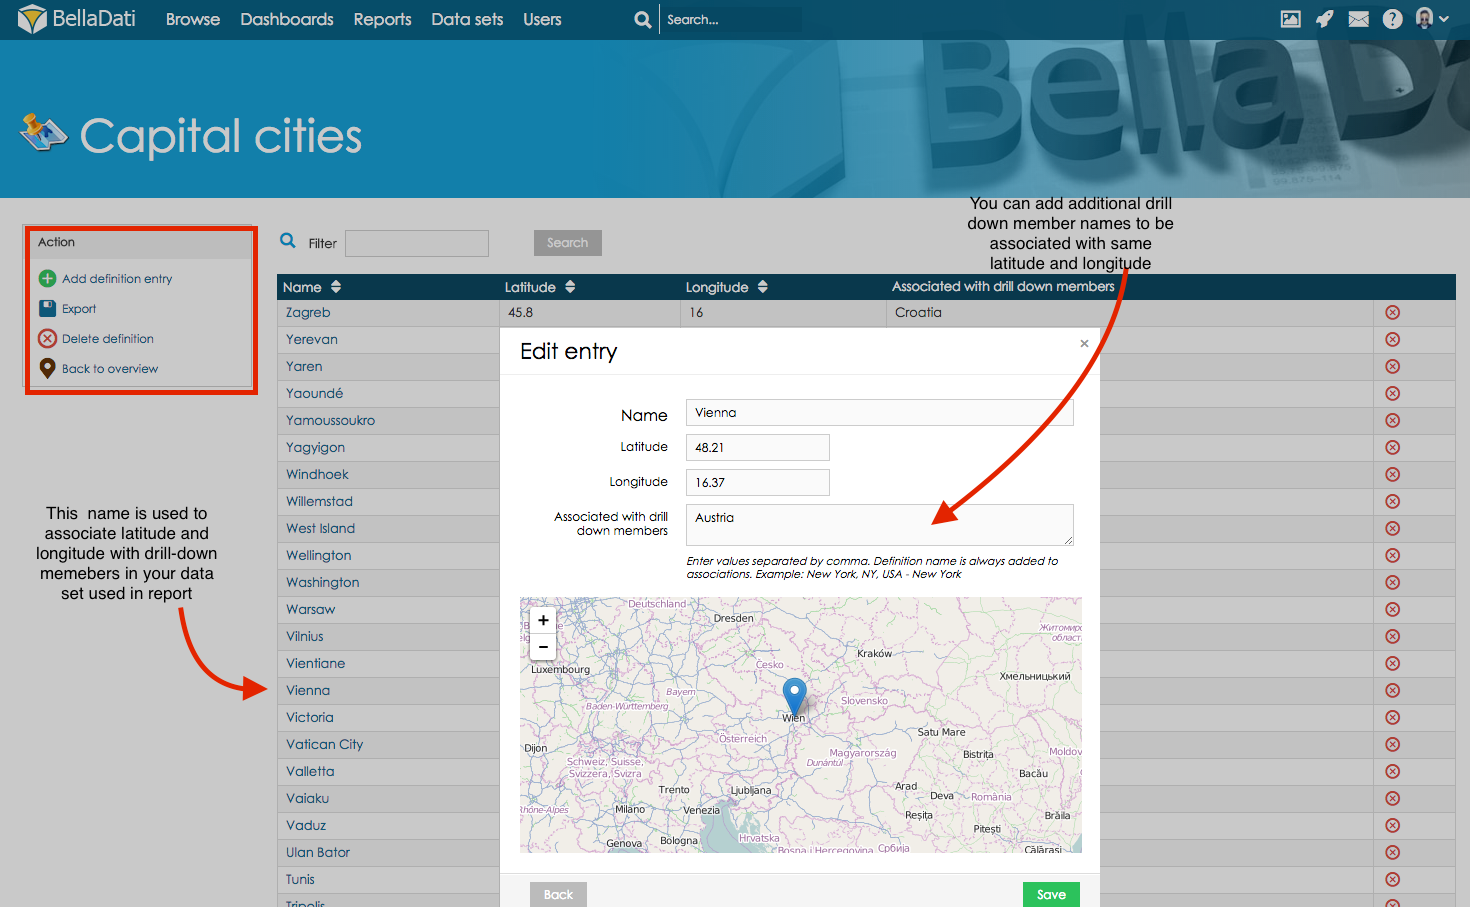
Uploading GEO Points definition
On the screen of the particular GEO points definition user can edit following parameters
GEO RegionsEach GEO region is defined by three or usually more points specified by latitude and longitude coordinantes. Standardized GeoJSON format is supported to simplify importing these definitions. You have to define associated drill-down values to match drill-down members in the report view. You can associate more drill-down values to single GEO region definition. Upper and lower case are distinguished (eg. Canada, canada, CAN are different values). Following parameters are manageable for GEO regions:
Map providers
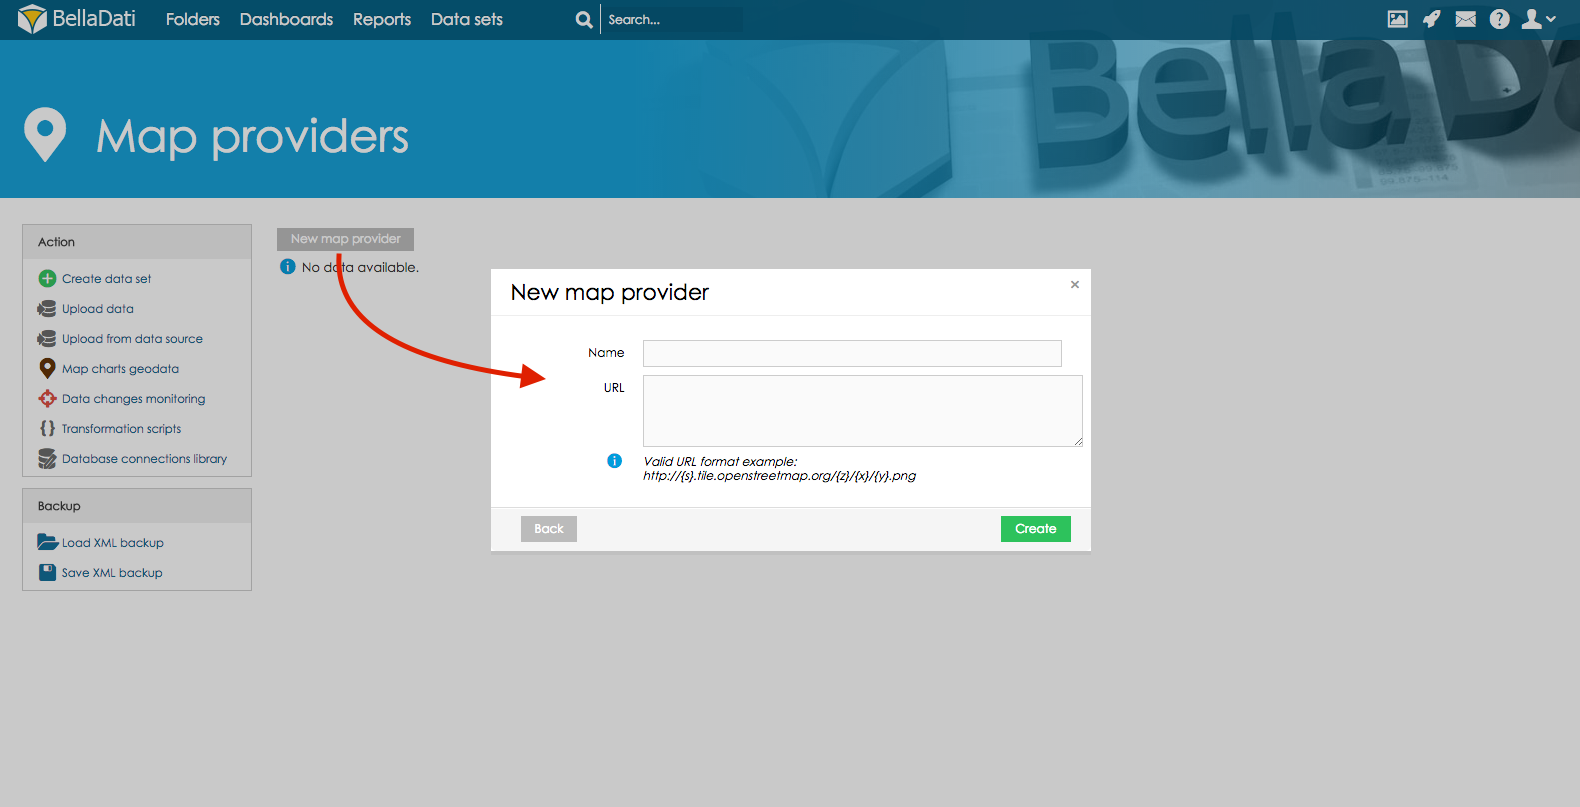
Custom map providers are supported. You can add your own map provider to use in map charts.
2. Click on New map provider. In the popup window name your map provider and paste its URL.
Creating own map tile server
We suggest using this tutorial for installing and configuring your map tile server. It is compatible with Ubuntu (tested on version 14.04). More info can be found here:
Maps can be downloaded from these links:
After successful start of server, copy the URL (or IP adress) and paste it in BellaDati in correct format (see Map Providers above) Next Steps |
...
Overview
Content Tools