Page History
| Sv translation | ||
|---|---|---|
| ||
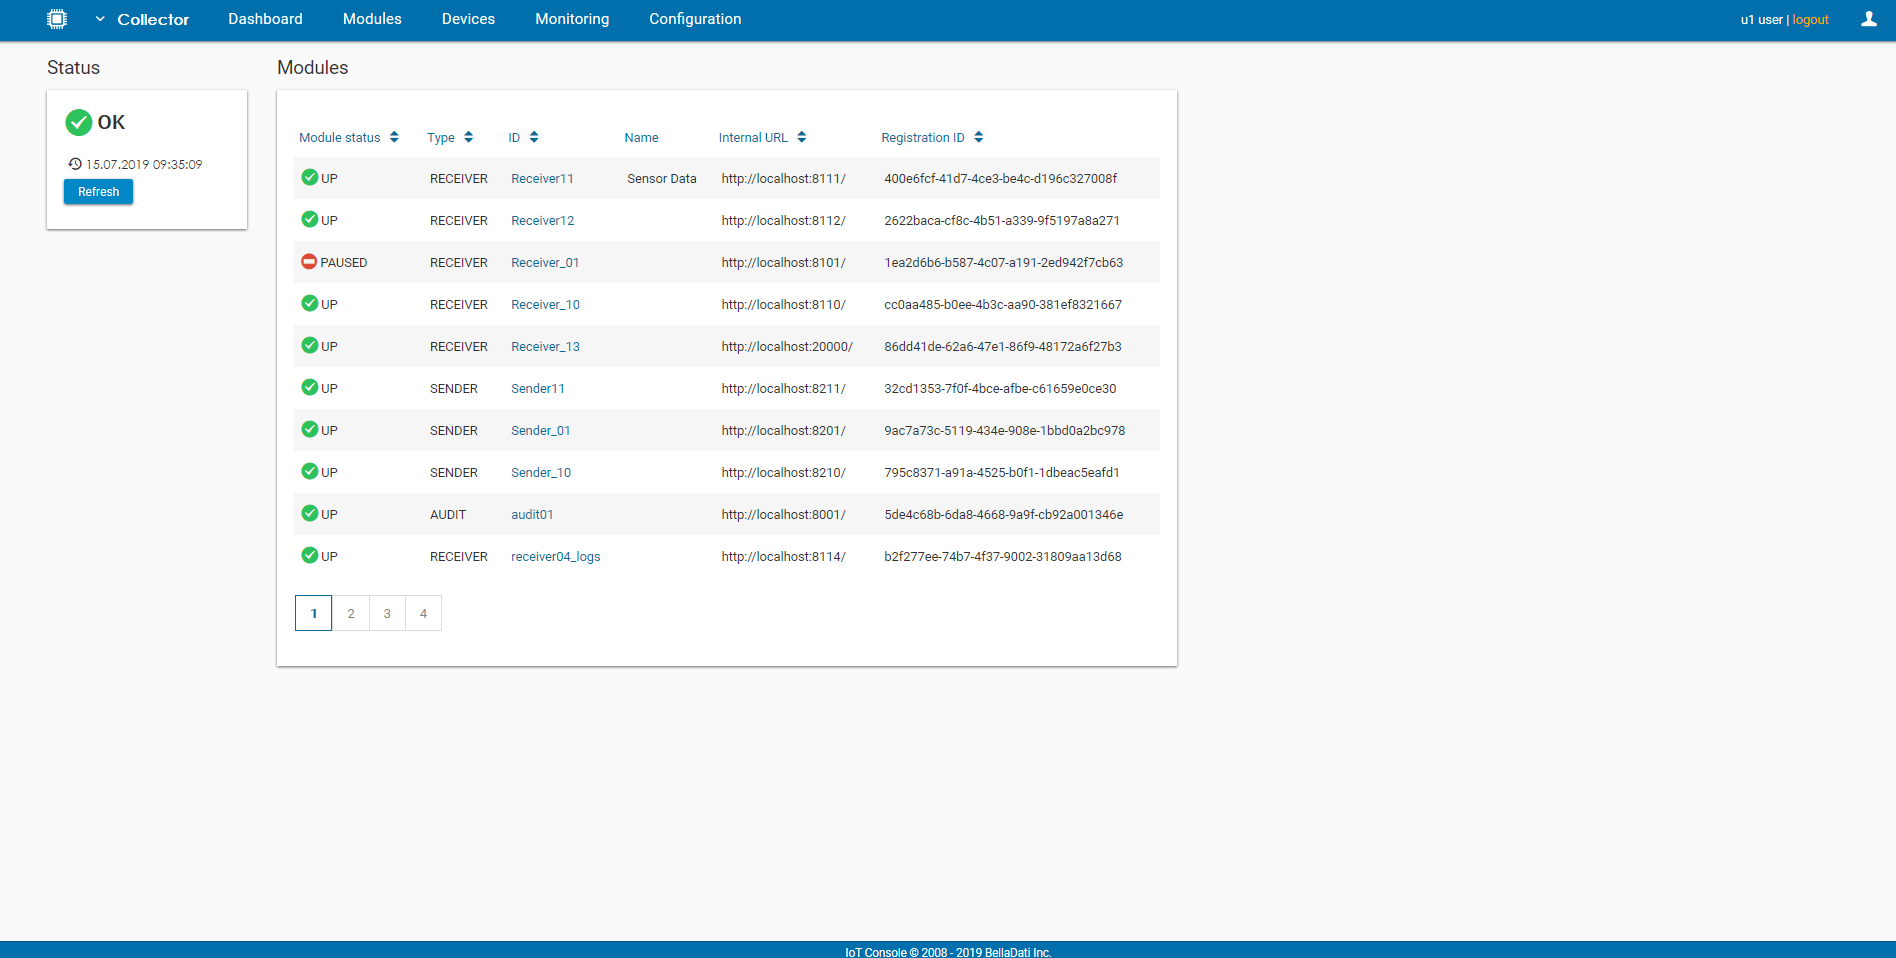
The dashboard serves and an entry point of the Management Console. It displays the status of the Collector and its modules. The page is divided into two boxes:
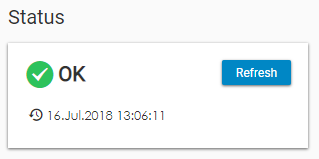
StatusThe Status box displays the status of the IoT Data Collector. The button Refresh is used to load the latest data from the Audit. The date and time of last update can be found at the bottom of this box.
ModulesThe Modules box displays a list of all available modules and basic information about each one of them (Status, Type, ID, Name, Internal URL, Registration). Users can change the order of the table by clicking on the header. The detail of a module can be opened by clicking on the row or the name of the module.
|
| Sv translation | ||
|---|---|---|
| ||
ダッシュボードは、管理コンソールのエントリポイントとして機能します。コレクターとそのモジュールのステータスが表示されます。 ページは2つのボックスに分かれています The dashboard serves and an entry point of the Management Console. It displays the status of the Collector and its modules. The page is divided into two boxes:
ステータスThe Status box displays the status of the IoT Data Collector. The button Refresh is used to load the latest data from the Audit. The date and time of last update can be found at the bottom of this box.
Modules[Status] ボックスには、IoTデータコレクターのステータスが表示されます。 [Refresh]ボタンは、Auditから最新のデータを読み込むために使用されます。最終更新の日時は、このボックスの下部にあります。
モジュール[Modules] ボックスには、使用可能なすべてのモジュールのリストと、各モジュールに関する基本情報 The Modules box displays a list of all available modules and basic information about each one of them (Status, Type, ID, Name, Internal URL, Registration) . Users can change the order of the table by clicking on the header. The detail of a module can be opened by clicking on the row or the name of the module.が表示されます。ユーザーは、ヘッダーをクリックしてテーブルの順序を変更できます。モジュールの詳細は、モジュールの行または名前をクリックして開くことができます。
|
Overview
Content Tools