Chart appearance
You can edit Chart appearance from Table settings dialog after selecting Chart appearance or directly from the toolbox list.
Each chart type includes relevant subset of appearance options.
Appearance dialog allows you to:
- Specify Color theme and Title color
- Separate to columns. You can specify to how many columns will be the charts displayed within the view, if there are more columns (default is one chart per row).Applicable for two or more indicators within one view.
- Value range: You can override default lower and upper limits for displaying data on Y axis. Note: Both limits must be set at the same time.
- Chart axis: Hide X axis, Hide Y axis
- Members on horizontal axis: Applicable if drill-down and time dimension are set together. Date/time information are displayed on X axis by standard. Use this feature to display drill-down members on X axis instead (date/time information will be distinguished by legend).
- Group values
- Show values

Displaying chart in "Scroll mode"
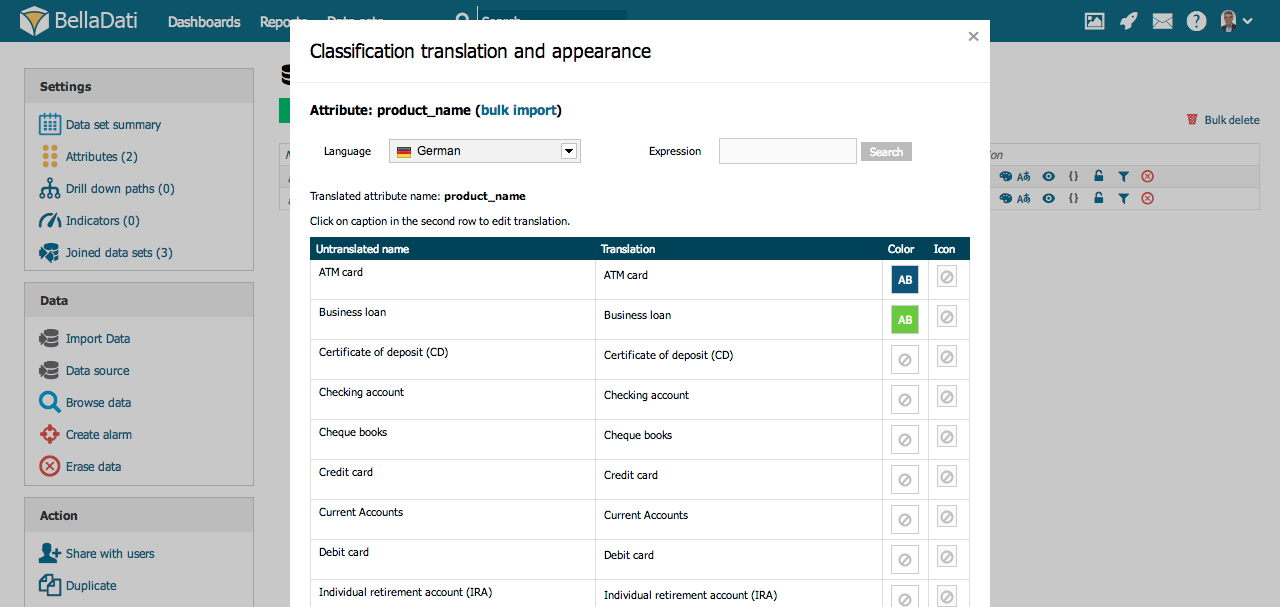
Attribute values appearance
Member appearance allows you to adjust and modify color, icon and translation of drill down members.
You can access Member appearance from Attribute selection dialog. Displayed members will refer to the attribute currently selected in the Add drill down path option.
Classification translation and appearance dialog enables:
- modifying node's font color and background
- assigning icon
- adjusting translations
These changes will affect all views and reports based on this data set. You must have editiong permissions to perform such changes.
See Members appearance and Attributes and members translation for more details.
Overview
Content Tools