XY charts displays two groups of indicators as one serie of XY coordinates. XY charts show the relatedness of number values. As XY chart should be used scatter chart or line chart.
In XY scatter chart, there are displayed indicators on both axis of the chart. In BellaDati, there can be displayed indicator value on one axis only, so we have to transform indicator value into new attribute.
1. Transform indicator into attribute
Open source data set. Create new attribute of type Text.
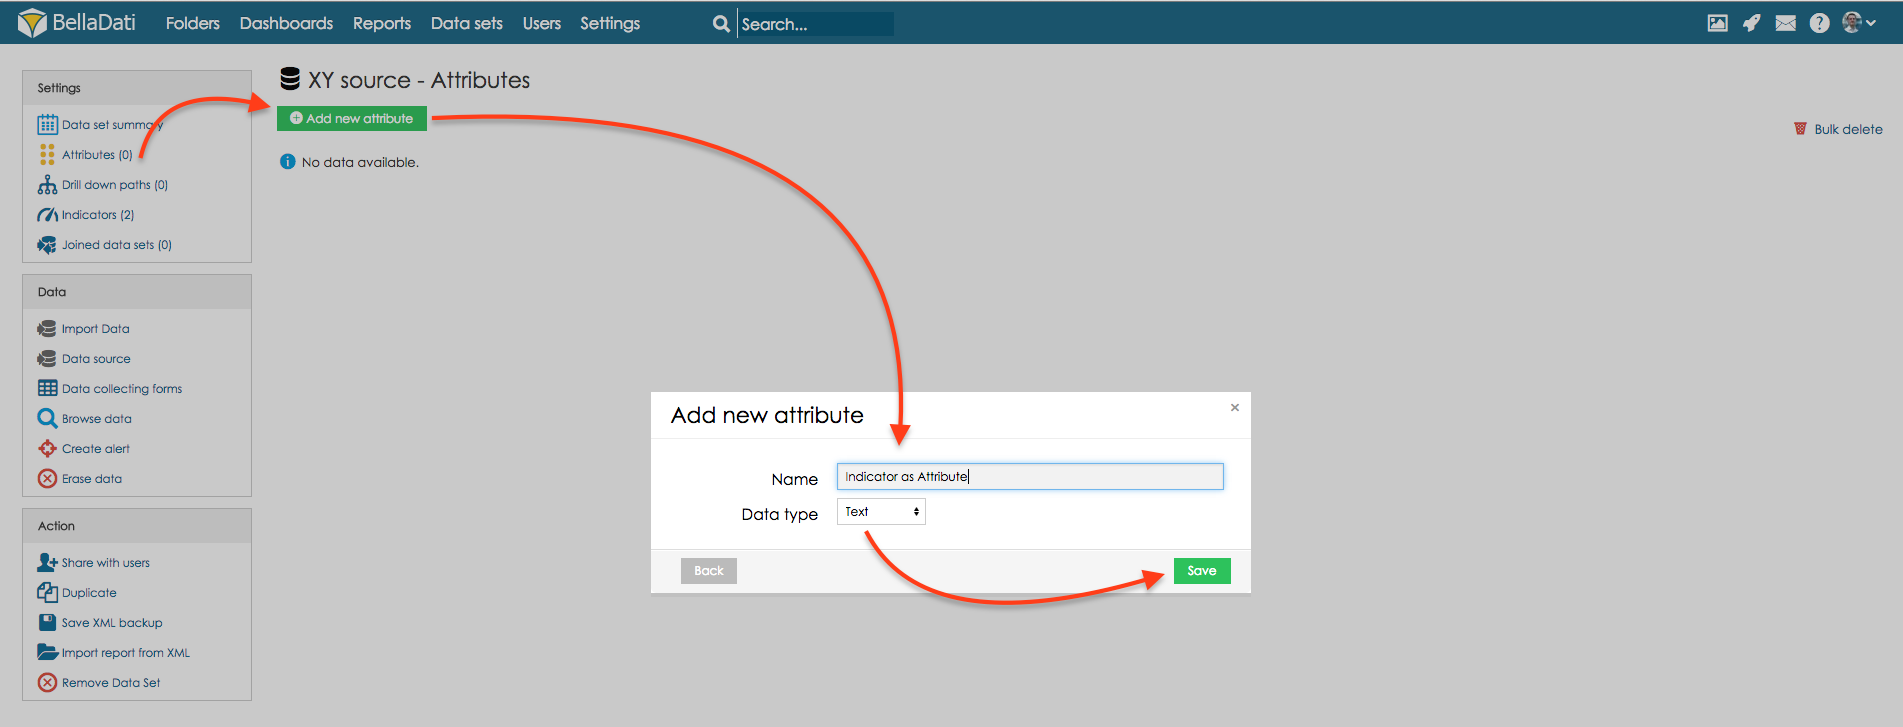
Transform indicator values into this attribute. For this option, click on transformation script icon of newly created attribute and use transformation script, that will return value with indicator values:
![]()
For more information about transformation scripting, go to Developers section.
2. Create chart
Now, go back to the report, which is based on this data set or create new report.
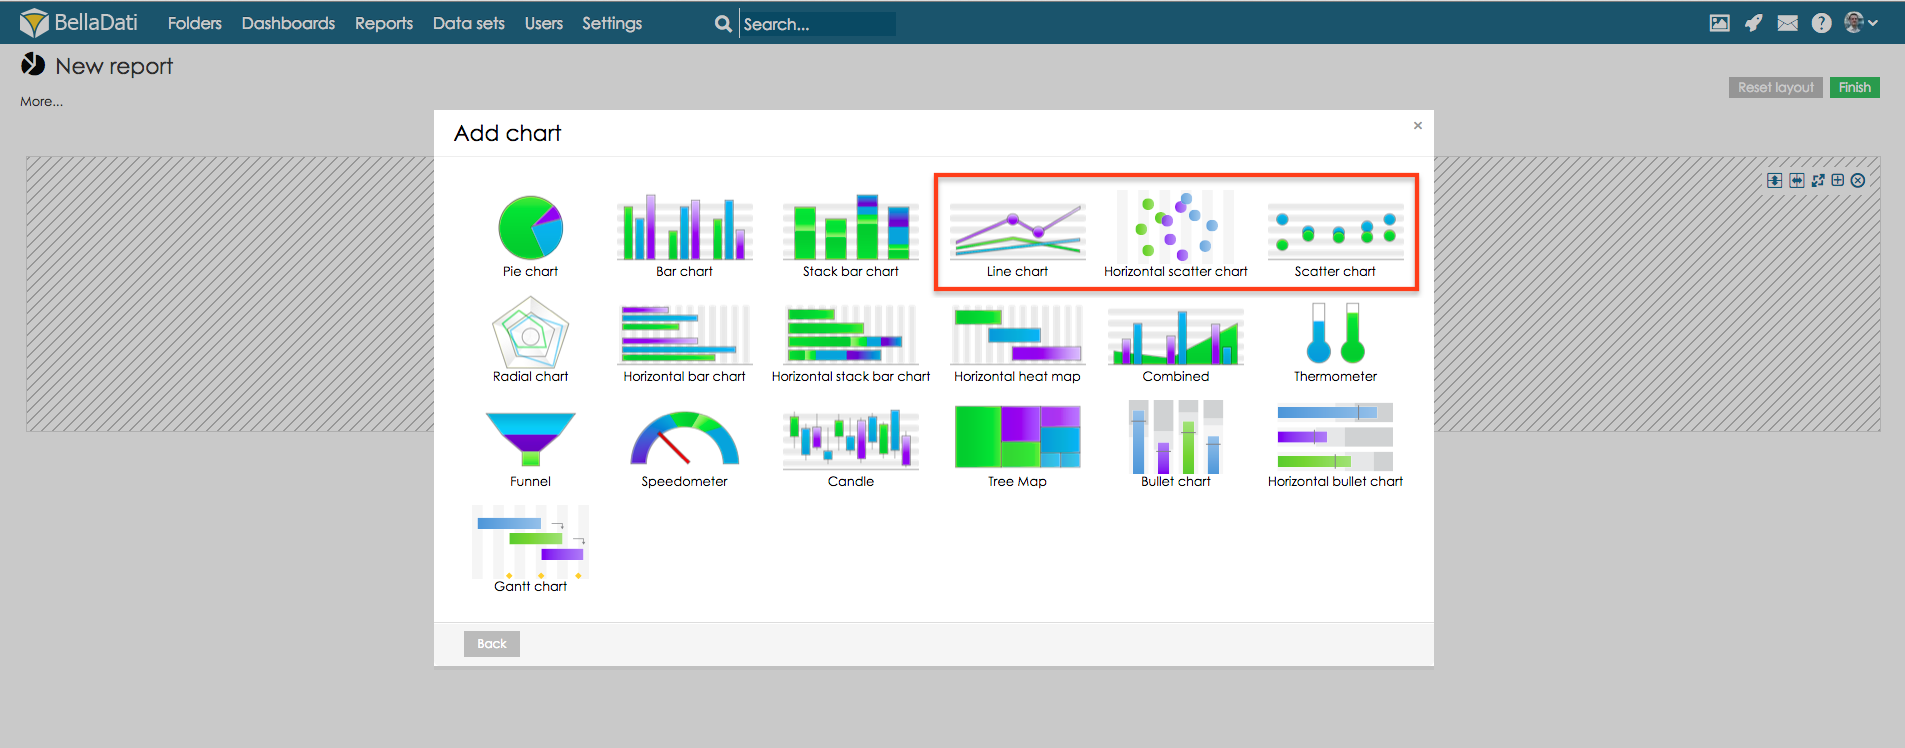
Now let's create new XY chart. Create new view, select scatter chart, horizontal scatter chart or line chart.
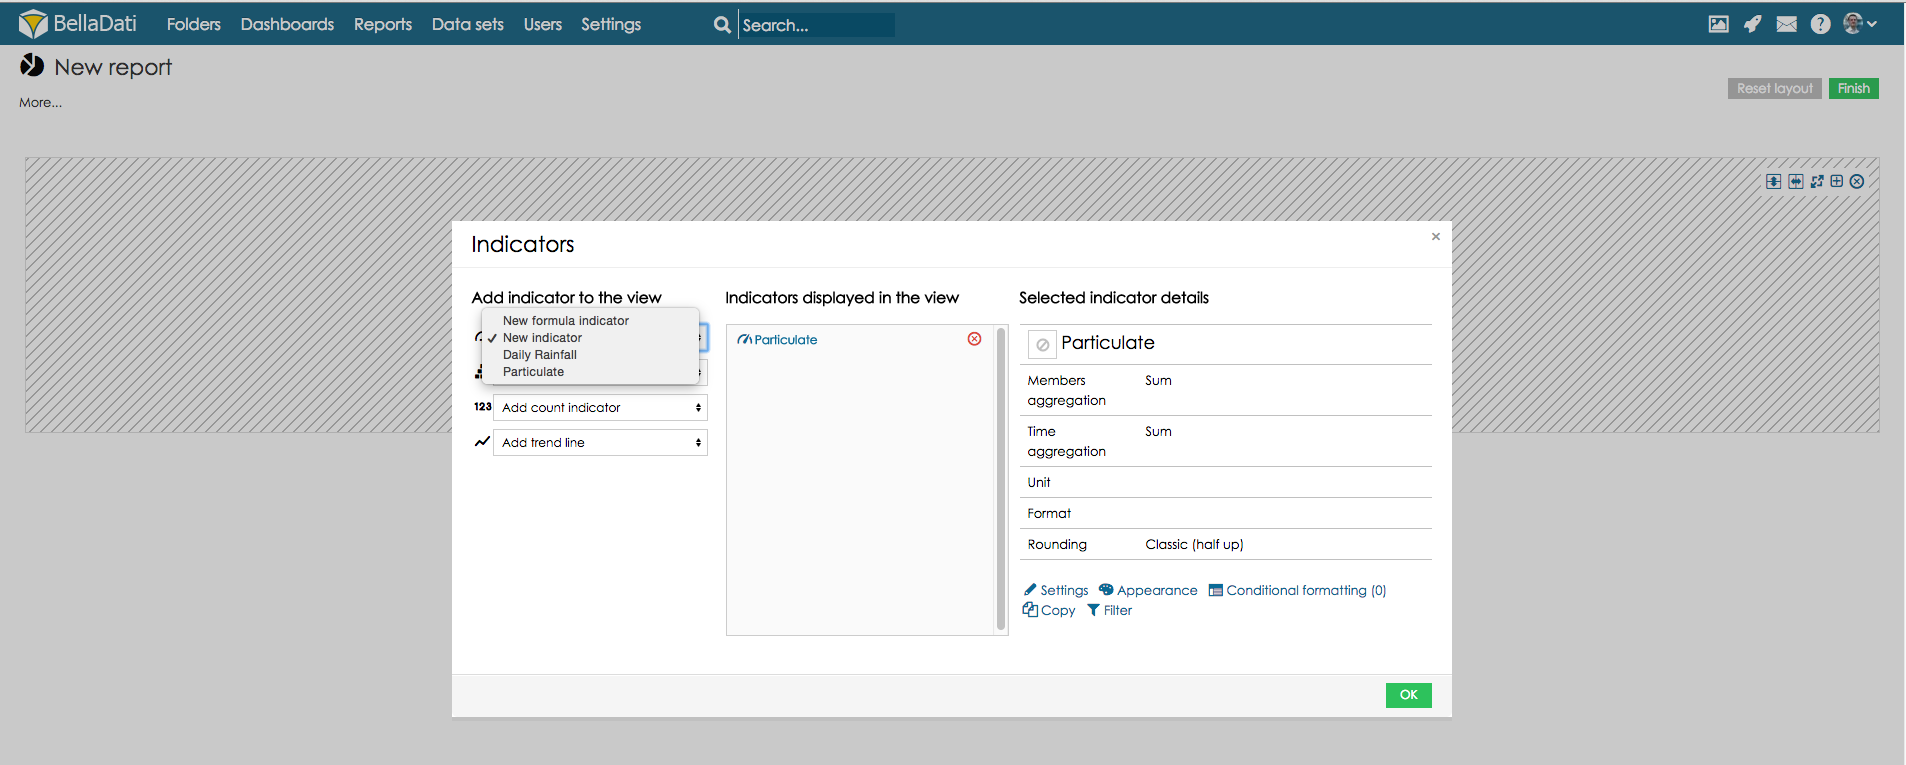
Select indicator which should be displayed.
Select drill-down that contains indicator values.
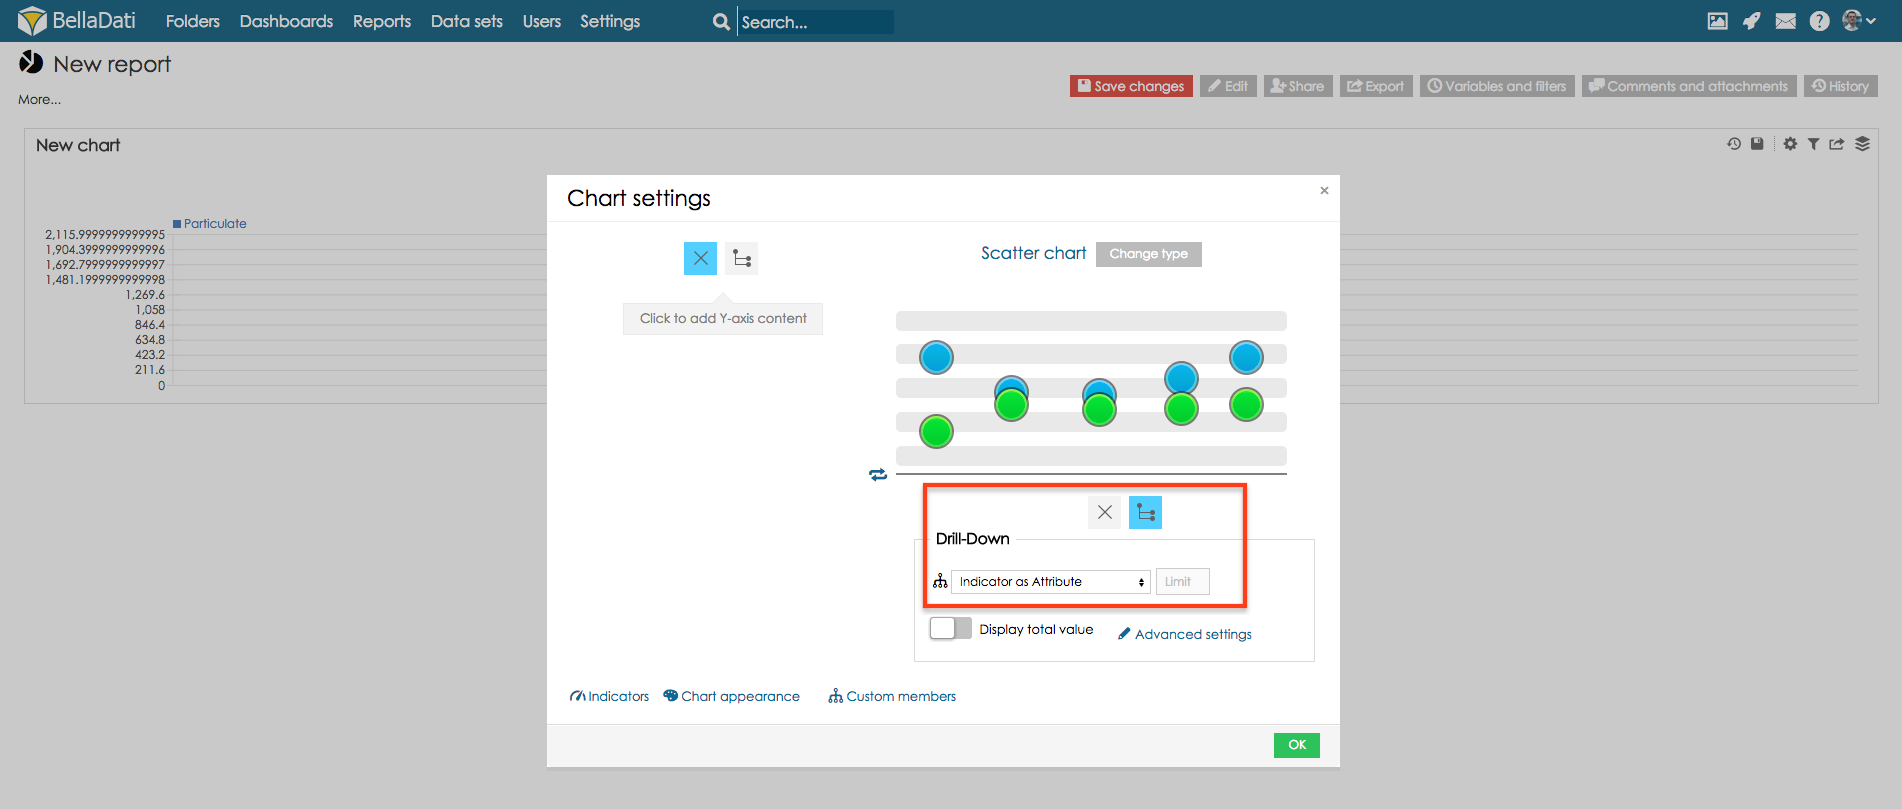
XY chart is created.

3. Additional settings
Problem: source data contain a lot of different values. This causes that values are not displayed correctly on axis with attribute.

Solution: in this case, we need to round values displayed in the attribute.
4. Create chart with regression function
For this case, we will use function Y=AX+B
Overview
Content Tools